arcgis api for javascript 4.12 vue 点聚合(2)
这是我第二篇关于vue使用arcGis点聚合的文章,第一篇比较繁琐,写的时候也是半懂,这里对其简化,有些功能也省去,所以想看上一篇的,这里有链接arcgis,使用的插件依旧是FlareClusterLayer(插件链接)
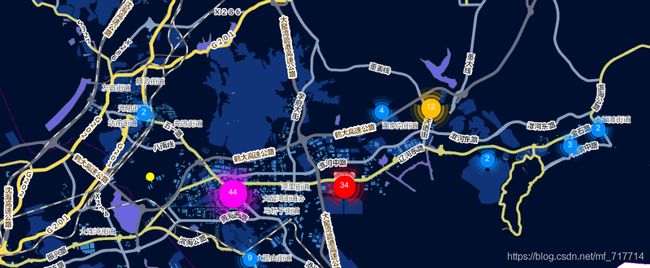
1,首先看下效果
2,引入插件
引入插件的方式,上一篇已经介绍,这里简单说一下,
- 引入插件需要使用绝对地址,打包后需要注意地址引入的方式
- 在public/index.html中引入插件
- 使用script,不要加 type=“text/javascript”
<script>
  var dojoConfig = {
    async: true,
    tlmSiblingOfDojo: false,
    packages: [{
      name: "fcl",
      location: '<%= BASE_URL %>fcl/'
    }],
    has: {
      "esri-promise-compatibility": 1
    }
  };
</script>
3,源码
<template>
    <div id="container">
        <div class="view" id="views"></div>
    </div>
</template>

<script>
    import {loadModules} from 'esri-loader'
    import nodesData from './data.json'

    export default {
        name: 'HelloWorld',
        data() {
            return {
                map: 'http://47.110.60.95:6080/arcgis/rest/services//测试/MapServer?f=jsapi',
                m1: require('@/assets/m1.png'),
                m2: require('@/assets/m2.png'),
                m3: require('@/assets/m3.png'),
                m4: require('@/assets/m4.png'),
                vueArcGis: {
                    ClassBreaksRenderer: null,
                    SpatialReference: null,
                    PopupTemplate: null,
                    fcl: null
                },
                newArcGis: {
                    map: null
                }
            }
        },
        methods: {
            async initLayer(data) {
                // 设置点聚合大小
                const renderer = this.createClusterRenderer();

				// 配置属性
                const options = {
                    clusterRenderer: renderer,
                    spatialReference: new this.vueArcGis.SpatialReference({
                        "wkid": 4326
                    }),
                    displayFlares: false,             // 是否显示聚合子类,即环绕周围的小圆圈
                    clusterRatio: 200,                // 设置每个集群边界的大小
                    data: data
                }

                const clusterLayer = new this.vueArcGis.fcl.FlareClusterLayer(options);
                this.newArcGis.map.add(clusterLayer);
            },
            createClusterRenderer() {
                let defaultSym = this.createPointSymbol([255, 255, 0], 'circle', 10, [255, 255, 0], 1);
                let renderer = new this.vueArcGis.ClassBreaksRenderer({
                    defaultSymbol: defaultSym
                });
                renderer.field = "clusterCount";
                const smSymbol = this.createPictureSymbol(this.m1, '53px', '53px');
                const mdSymbol = this.createPictureSymbol(this.m2, '70px', '70px');
                const lgSymbol = this.createPictureSymbol(this.m3, '80px', '80px');
                const xlSymbol = this.createPictureSymbol(this.m4, '100px', '100px');

                renderer.addClassBreakInfo(0, 10, smSymbol);
                renderer.addClassBreakInfo(11, 20, mdSymbol);
                renderer.addClassBreakInfo(21, 40, lgSymbol);
                renderer.addClassBreakInfo(41, Infinity, xlSymbol);

                return renderer
            },
            createPictureSymbol(url, width, height) {
                return {
                    type: "picture-marker",
                    url, width, height
                };
            },
            createPointSymbol(color, style, size, outlineColor, outlineWidth) {
                return {
                    type: "simple-marker",
                    style: style,
                    color: color,
                    size: size,
                    outline: {
                        color: outlineColor,
                        width: outlineWidth
                    }
                };
            },
            createSimpleFillSymbol(color, style = 'solid', outlineColor, outlineWidth) {
                return {
                    type: "simple-fill",
                    style,
                    color,
                    outline: {
                        color: outlineColor,
                        width: outlineWidth
                    }
                }
            }
        },
        mounted() {
            loadModules([
                "esri/Map",
                "esri/views/MapView",
                "esri/layers/MapImageLayer",
                "esri/renderers/ClassBreaksRenderer",
                "esri/geometry/SpatialReference",
                "fcl/FlareClusterLayer_v4",
                "esri/PopupTemplate"
            ])
                .then(([Map, MapView, MapImageLayer, ClassBreaksRenderer, SpatialReference, fcl, PopupTemplate]) => {

                    this.vueArcGis = {
                        ClassBreaksRenderer, SpatialReference, PopupTemplate, fcl
                    };

                    const mapLayer = new MapImageLayer({url: this.map}) // 底图地图
                    const map = new Map({
                        layers: [mapLayer]
                    });
                    const mapView = new MapView({
                        map: map,
                        container: "views",
                        center: [121.8192766890, 39.0565858993], // 大连 中心点
                        scale: 164521
                    });

                    mapView.ui._removeComponents(["attribution"]); //去掉logo
                    mapView.ui.move(["zoom"], "bottom-right"); // 缩放控件移动到右下方

                    mapView.when(() => {
                        const allPoints = []
                        for (const key in nodesData) {
                            const {x, y = null} = nodesData[key]
                            if (x && y) {
                                allPoints.push({
                                    x, y, key
                                })
                            }
                        }
                        this.initLayer(allPoints);
                    });

                    this.newArcGis = {map}
                })
                .catch(() => {
                    // handle any errors
                    //console.error(err);
                });
        }
    }
</script>

<style>

    #container, .view {
        width: 100vw;
        height: 100vh;
        padding: 0;
        margin: 0;
    }

</style>
4,data数据
const nodesData = []

for (var i = 1; i < 100; i++) {

    nodesData.push({
        "x": 121.8192766890 + readomX() * i* 0.01,
        "y": 39.0565858993 + readomY() * i * 0.001,
    })
}

function readomX() {
    return Math.round(Math.random());
}

function readomY() {
    return Math.round(Math.random());
}
