数据处理之特征选择知识
文章目录
- 前言
- 1.什么是特征工程?
- 2.数据预处理
- 2.1无量纲化(数据规范化)
- 2.1.1标准化(也叫Z-score standardization)
- 2.1.2区间缩放(对列向量处理)
- 2.1.3归一化(对行向量处理)
- 2.2对定量特征二值化
- 2.3对定性特征哑编码
- 2.4缺失值计算
- 2.5数据变换
- 2.5.1多项式变换
- 2.5.2自定义变换
- 总结
- 3.特征选择
- 3.1Filter
- 3.1.1方差选择法
- 3.1.2单变量特征选择
- 3.1.2.1卡方检验
- 3.1.2.2Pearson相关系数
- 3.1.3互信息与最大信息系数
- 3.1.4距离相关系数
- 3.2Wrappper
- 3.2.1递归特征消除发
- 3.3Embedded
- 3.3.1基于惩罚项的特征选择法
- 3.3.2基于树模型的特征选择法
- 总结
- 4.降维
- 4.1主成分分析法(PAC)
- 4.2线性判别分析法(LDA)
- 总结
前言
做特征工程是Kaggle比赛中很重要的一部分,而sklearn是做特征工程(做模型调算 法)常用也是好用的工具没有之一
1.什么是特征工程?
有这么一句话在业界广泛流传,数据和特征决定了机器学习的上限,而模型和算法只是逼近这个上限而已。那特征工 程到底是什么呢?顾名思义,其本质是一项工程活动,目的是大限度地从原始数据中提取特征以供算法和模型使 用。
特征工程主要分为三部分:
- 数据预处理 对应的sklearn包:sklearn-Processing data
- 特征选择 对应的sklearn包: sklearn-Feature selection
- 降维 对应的sklearn包: sklearn-Dimensionality reduction
本文中使用sklearn中的IRIS(鸢尾花)数据集来对特征处理功能进行说明,首先导入IRIS数据集的代码如下:
1 from sklearn.datasets import load_iris
2
3 #导入IRIS数据集
4 iris = load_iris()
5
6 #特征矩阵
7 iris.data
8
9 #目标向量
10 iris.target
2.数据预处理
通过特征提取,我们能得到未经处理的特征,这时的特征可能有以下问题:
- 不属于同一量纲:即特征的规格不一样,不能够放在一起比较。无量纲化可以解决这一问题。
- 信息冗余:对于某些定量特征,其包含的有效信息为区间划分,例如学习成绩,假若只关心“及格”或不“及格”,那么需要将定量的考分,转换成“1”和“0”表示及格和未及格。二值化可以解决这一问题。
- 定性特征不能直接使用:通常使用哑编码的方式将定性特征转换为定量特征,假设有N种定性值,则将这一个特 征扩展为N种特征,当原始特征值为第i种定性值时,第i个扩展特征赋值为1,其他扩展特征赋值为0。哑编码的方式相比直接指定的方式,不用增加调参的工作,对于线性模型来说,使用哑编码后的特征可达到非线性的效果。
- 存在缺失值:填充缺失值。
- 信息利用率低:不同的机器学习算法和模型对数据中信息的利用是不同的,之前提到在线性模型中,使用对定 性特征哑编码可以达到非线性的效果。类似地,对定量变量多项式化,或者进行其他的数据变换,都能达到非 线性的效果。
2.1无量纲化(数据规范化)
无量纲化使不同规格的数据转换到同一规格
from sklearn.preprocessing import StandardScaler
#标准化,返回值为标准化后的数据
StandardScaler().fit_transform(iris.data)

#array([[ -9.00681170e-01,   1.03205722e+00,  -1.34127240e+00,
#         -1.31297673e+00],
#       [ -1.14301691e+00,  -1.24957601e-01,  -1.34127240e+00,
#         -1.31297673e+00],
#   ...

# --- 例子就是如下,他是对列也就是同一特征下进行缩放,而不是对一个数据的不同特征之间(行)进行缩放 --
from sklearn.preprocessing import StandardScaler
data = np.array([[1,2],[3,4],[5,6]]).reshape(3,2)
print(data)
# [[1 2]
# [3 4]
# [5 6]]
print (np.mean(data,axis=0) )
# 计算每一列均值  [ 3.  4.]
print ( np.std(data,axis=0))   # 计算每一列标准差  [ 1.63299316  1.63299316]
print ((data[0][0]-np.mean(data,axis=0)[0])/np.std(data,axis=0)[0] ) # 计算第一个元素的标准化后的值   -1.22474487139

#区间缩放,返回值为缩放到[0, 1]区间的数据
StandardScaler().fit_transform(data)

# array([[-1.22474487, -1.22474487],
#       [ 0.        ,  0.        ],
#       [ 1.22474487,  1.22474487]])
2.1.1标准化(也叫Z-score standardization)
将服从正态分布的特征值转换成标准正态分布,标准化需要计算特征的均值和标准差,公式表达为: x ′ = x − X ˉ S x'=\frac{x-\bar{X}}{S} x′=Sx−Xˉ
使用preproccessing库的StandardScaler类对数据进行标准化的代码如下:
1 from sklearn.preprocessing import StandardScaler
2
3 #标准化,返回值为标准化后的数据
4 StandardScaler().fit_transform(iris.data)
2.1.2区间缩放(对列向量处理)
区间缩放法的思路有多种,常见的一种为利用两个值进行缩放,公式表达为: x ′ = x − M i n M a x − M i n x'=\frac{x-Min}{Max-Min} x′=Max−Minx−Min
使用preproccessing库的MinMaxScaler类对数据进行区间缩放的代码如下:
1 from sklearn.preprocessing import MinMaxScaler
2
3 #区间缩放,返回值为缩放到[0, 1]区间的数据
4 MinMaxScaler().fit_transform(iris.data)

# --- 例子就是如下,他是对列也就是同一特征下进行缩放,而不是对一个数据的不同特征之间(行)进行缩放 --
from sklearn.preprocessing import MinMaxScaler
data = np.array([[1,2],[3,4],[5,6]]).reshape(3,2)
print (data)
# [[1 2]
# [3 4]
# [5 6]]
# 区间缩放,返回值为缩放到[0, 1]区间的数据
MinMaxScaler().fit_transform(data)
#array([[ 0. ,  0. ],
#       [ 0.5,  0.5],
#       [ 1. ,  1. ]])
在什么时候使用标准化比较好,什么时候区间缩放比较好呢?
- 在后续的分类、聚类算法中,需要使用距离来度量相似性的时候、或者使用PCA、LDA这些需要用到协方差分析进行降维的时候,同时数据分布可以近似为正态分布,标准化方法(Z-score standardization)表现更好。(标准化好 一点)
- 在不涉及距离度量、协方差计算、数据不符合正态分布的时候,可以使用区间缩放法或其他归一化方法。 比如图像处理中,将RGB图像转换为灰度图像后将其值限定在[0 255]的范围。(归一化好点)
2.1.3归一化(对行向量处理)
- 归一化目的在于样本向量在点乘运算或其他核函数计算相似性时,拥有统一的标准,也就是说都转化为“单位向量”。
- 规则为l2的归一化公式如下: x ′ = x ∑ j m x [ j ] 2 x'=\frac{x}{\sqrt{\sum_j^m}x[j]^{2}} x′=∑jmx[j]2x
使用preproccessing库的Normalizer类对数据进行归一化的代码如下:
1 from sklearn.preprocessing import Normalizer
2
3 #归一化,返回值为归一化后的数据
4 Normalizer().fit_transform(iris.data)

# --- 例子就是如下,他是对一行数据的不同特征进行处理 --
from sklearn.preprocessing import Normalizer
import math
data = np.array([[1,2],[3,4],[5,6]]).reshape(3,2)
print (data)
# [[1 2]
# [3 4]
# [5 6]]
print (data[0][0]/math.sqrt((data[0][0])**2 + (data[0][1])**2))
# 计算第一个元素L2正则化后的值   0.4472135955

# 规范化
Normalizer().fit_transform(data)

array([[ 0.4472136 ,  0.89442719],
       [ 0.6       ,  0.8       ],
       [ 0.6401844 ,  0.76822128]])
这里比较搞混的一点是StandardScaler和Normalizer这个两个概念的问题(大家翻译上的误差导致信息非常混乱),其实StandardScaler就是尺寸缩放问题,即使同一特征下的数值在一定范围内浮动,如将数值所放在0-1范围内 (MinMaxScaler), 或者将数据标准化成为均值为0,方差为1的数据(Z-score);而另一个就是Normalizer,将同一行数据的不同特征进行规范化,这样一个数据的不同特征具有相同的量纲或者表现力,比如说一个特征是身高,1.7m,体重为150斤,那么两个特征之间差距太大,身高这个特征变化根本无法起到决定作用(在体重这个变化特征下),毕竟大家怎么长都是一米多,但是体重差距一下子拉开20多是很正常的事
2.2对定量特征二值化
定性与定量区别
定性:博主很胖,博主很瘦
定量:博主有80kg,博主有60kg
一般定性都会有相关的描述词,定量的描述都是可以用数字来量化处理
定量特征二值化的核心在于设定一个阈值,大于阈值的赋值为1,小于等于阈值的赋值为0,公式表达如下:
x ′ = { 1 x > t h r e s h o l d 0 x ≤ t h r e s h o l d x'=\begin{cases}1 & x > threshold\\0 & x \leq threshold\end{cases} x′={10x>thresholdx≤threshold
使用preproccessing库的Binarizer类对数据进行二值化的代码如下:
1 from sklearn.preprocessing import Binarizer
2
3 #二值化,阈值设置为3,返回值为二值化后的数据
4 Binarizer(threshold=3).fit_transform(iris.data)
2.3对定性特征哑编码
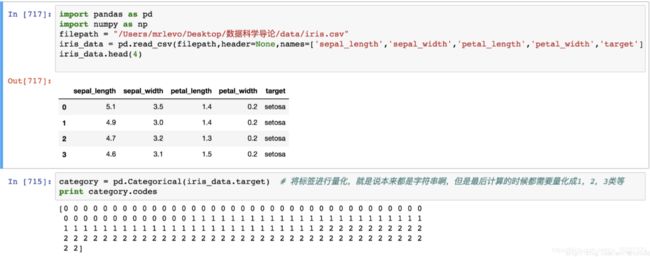
因为有些特征是用文字分类表达的,或者说将这些类转化为数字,但是数字与数字之间是没有大小关系的,纯粹的分类标记,这时候就需要用哑编码对其进行编码。IRIS数据集的特征皆为定量特征,使用其目标值进行哑编码(实际上是不需要的)。
使用preproccessing库的OneHotEncoder类对数据进行哑编码的代码如下:
1 from sklearn.preprocessing import OneHotEncoder
2
3 #哑编码,对IRIS数据集的目标值,返回值为哑编码后的数据
4 OneHotEncoder().fit_transform(iris.target.reshape((-1,1)))
补充:但是从以一个角度来看,如果标签需要被量化,这个就很有用了, 如下图所示,将target这个标签转化成为数 值才能进行机器学习
2.4缺失值计算
由于IRIS数据集没有缺失值,故对数据集新增一个样本,4个特征均赋值为NaN,表示数据缺失。使用preproccessing库的Imputer类对数据进行缺失值计算的代码如下:
import numpy as np from sklearn.preprocessing
import Imputer
imp = Imputer(missing_values='NaN', strategy='mean', axis=0)
# 使用特征的均值进行填充,其余还有 使用众数填充等,只需要把mean改成median即可
data = np.array([np.nan, 2, 6, np.nan, 7, 6]).reshape(3,2)

print (data)
#   [[ nan   2.]
#    [  6.  nan]
#    [  7.   6.]]

print (imp.fit_transform(data))
#   [[ 6.5  2. ]
#    [ 6.   4. ]
#   [ 7.   6. ]]
2.5数据变换
2.5.1多项式变换
常见的数据变换有基于多项式的、基于指数函数的、基于对数函数的。4个特征,度为2的多项式转换公式如下: ( x 1 ′ , x 2 ′ , x 3 ′ , x 4 ′ , x 5 ′ , x 6 ′ , x 7 ′ , x 8 ′ , x 9 ′ , x 10 ′ , x 11 ′ , x 12 ′ , x 12 ′ , x 14 ′ , x 15 ′ ) = (x_{1}',x_{2}',x_{3}',x_{4}',x_{5}',x_{6}',x_{7}',x_{8}',x_{9}',x_{10}',x_{11}',x_{12}',x_{12}',x_{14}',x_{15}')= (x1′,x2′,x3′,x4′,x5′,x6′,x7′,x8′,x9′,x10′,x11′,x12′,x12′,x14′,x15′)= ( 1 , x 1 , x 2 , x 3 , x 4 , x 1 2 , x 1 ∗ x 2 , x 1 ∗ x 3 , x 1 ∗ x 4 , x 2 2 , x 2 ∗ x 3 , x 2 ∗ x 4 , x 3 2 , x 3 ∗ x 4 , x 4 2 ) (1,x_{1},x_{2},x_{3},x_{4},x_{1}^{2},x_{1}*x_{2},x_{1}*x_{3},x_{1}*x_{4},x_{2}^{2},x_{2}*x_{3},x_{2}*x_{4},x_{3}^{2},x_{3}*x_{4},x_{4}^{2}) (1,x1,x2,x3,x4,x12,x1∗x2,x1∗x3,x1∗x4,x22,x2∗x3,x2∗x4,x32,x3∗x4,x42)
使用preproccessing库的PolynomialFeatures类对数据进行多项式转换的代码如下:
1 from sklearn.preprocessing import PolynomialFeatures
2
3 #多项式转换
4 #参数degree为度,默认值为2
5 PolynomialFeatures().fit_transform(iris.data)
2.5.2自定义变换
基于单变元函数的数据变换可以使用一个统一的方式完成,使用preproccessing库的FunctionTransformer对数据进行对数函数转换的代码如下:
1 from numpy import log1p
2 from sklearn.preprocessing
import FunctionTransformer
3
4 #自定义转换函数为对数函数的数据变换
5 #第一个参数是单变元函数
6 FunctionTransformer(log1p).fit_transform(iris.data)
总结
| 类 | 功能 | 说明 |
|---|---|---|
| StandardScaler | 无量纲化 | 标准化,基于特征矩阵的列,将特征值转换至服从标准正态 分布 |
| MinMaxScaler | 无量纲化 | 区间缩放,基于大小值,将特征值转换到[0, 1]区间上 |
| Normalizer | 归一化 | 基于特征矩阵的行,将样本向量转换为“单位向量” |
| Binarizer | 二值化 | 基于给定阈值,将定量特征按阈值划分 |
| OneHotEncoder | 哑编码 | 将定性数据编码为定量数据 |
| Imputer | 缺失值计算 | 计算缺失值,缺失值可填充为均值等 |
| PolynomialFeatures | 多项式数据转换 | 多项式数据转换 |
| FunctionTransformer | 自定义单元数据转换 | 使用单元的函数来转换数据 |
3.特征选择
当数据预处理完成后,我们需要选择有意义的特征输入机器学习的算法和模型进行训练。通常来说,从两个方面考虑 来选择特征:
- 特征是否发散:如果一个特征不发散,例如方差接近于0,也就是说样本在这个特征上基本上没有差异,这个特 征对于样本的区分并没有什么用。
- 特征与目标的相关性:这点比较显见,与目标相关性高的特征,应当优选选择。除方差法外,本文介绍的其他 方法均从相关性考虑。
根据特征选择的形式又可以将特征选择方法分为3种:
- Filter:过滤法,不用考虑后续学习器,按照发散性或者相关性对各个特征进行评分,设定阈值或者待选择阈值的个数,选择特征。
- Wrapper:包装法,需考虑后续学习器,根据目标函数(通常是预测效果评分),每次选择若干特征,或者排除若干特征。
- Embedded:嵌入法,是Filter与Wrapper方法的结合。先使用某些机器学习的算法和模型进行训练,得到各个 特征的权值系数,根据系数从大到小选择特征。
我们使用sklearn中的feature_selection库来进行特征选择。
3.1Filter
3.1.1方差选择法
使用方差选择法,先要计算各个特征的方差,然后根据阈值,选择方差大于阈值的特征。使用feature_selection库的 VarianceThreshold类来选择特征的代码如下:
1 from sklearn.feature_selection import VarianceThreshold
2
3 #方差选择法,返回值为特征选择后的数据
4 #参数threshold为方差的阈值
5 VarianceThreshold(threshold=3).fit_transform(iris.data)
3.1.2单变量特征选择
- 单变量特征选择能够对每一个特征进行测试,衡量该特征和目标变量之间的关系,根据得分扔掉不好的特征。对于回归和分类问题可以采用卡方检验等方式对特征进行测试。
- 方法简单,易于运行,易于理解,通常对于理解数据有较好的效果(但对特征优化、提高泛化能力来说不一定有效);这种方法有许多改进的版本、变种。
3.1.2.1卡方检验
(chi2卡方检验)使用分类问题(y离散)
- 经典的卡方检验(原理及应用)是检验定性自变量对定性因变量的相关性。假设自变量有N种取值,因变量有M种取 值,考虑自变量等于i且因变量等于j的样本频数的观察值与期望的差距,构建统计量,其中A为实际数,E为理论值: x 2 = ∑ ( A − E ) 2 E x^{2}=\sum\frac{(A-E)^{2}}{E} x2=∑E(A−E)2
- 检验特征对标签的相关性,选择其中K个与标签相关的特征。使用feature_selection库的SelectKBest类结合卡方检 验来选择特征的代码如下:(这个就是自变量与因变量的相关性的取值,看到k的取值)
1 from sklearn.feature_selection import SelectKBest
2 from sklearn.feature_selection import chi2
3
4 #选择K个好的特征,返回选择特征后的数据
5 SelectKBest(chi2, k=2).fit_transform(iris.data, iris.target)

# --- 例子 --
from sklearn.datasets import load_iris
from sklearn.feature_selection import SelectKBest
from sklearn.feature_selection import chi2
iris = load_iris()
X, y = iris.data, iris.target
X.shape
#(150, 4)
X_new = SelectKBest(chi2, k=2).fit_transform(X, y)
X_new.shape
#(150, 2)  直接砍掉了两个特征
3.1.2.2Pearson相关系数
适用于回归问题(y连续值)
- 皮尔森相关系数是一种简单的,能帮助理解特征和目标变量之间关系的方法,该方法衡量的是变量之间的线性相关性,结果的取值区间为[-1,1],-1表示完全的负相关,+1表示完全的正相关,0表示没有线性相关。
- Pearson Correlation速度快、易于计算,经常在拿到数据(经过清洗和特征提取之后的)之后第一时间就执行。Scipy的 pearsonr 方法能够同时计算 相关系数 和p-value。
import numpy as np from scipy.stats
import pearsonr
np.random.seed(0)
size = 300
x = np.random.normal(0, 1, size)
# pearsonr(x, y)的输入为特征矩阵和目标向量
# np.random.normal(0, 1, 100) 创建100个均值为0,方差为1的高斯随机数
print("Lower noise", pearsonr(x, x + np.random.normal(0, 1, size)))
print("Higher noise", pearsonr(x, x + np.random.normal(0, 10, size)))

# 输出为二元组(sorce, p-value)的数组
Lower noise (0.71824836862138386, 7.3240173129992273e-49)
Higher noise (0.057964292079338148, 0.31700993885324746)
3.1.3互信息与最大信息系数
经典的互信息(互信息为随机变量X与Y之间的互信息I(X;Y)I(X;Y)为单个事件之间互信息的数学期望)也是评价定性自 变量对定性因变量的相关性的,互信息计算公式如下:
I ( X , Y ) = ∫ X ∫ Y P ( X , Y ) log P ( X , Y ) P ( X ) P ( Y ) I(X,Y)=\int_{X}^{} \int_{Y}^{} P(X,Y)\log_{}{\frac{P(X,Y)}{P(X)P(Y)}} I(X,Y)=∫X∫YP(X,Y)logP(X)P(Y)P(X,Y)
互信息直接用于特征选择其实不是太方便:
- 它不属于度量方式,也没有办法归一化,在不同数据及上的结果无法做比较
- 对于连续变量的计算不是很方便(X和Y都是集合,x,y都是离散的取值),通常变量需要先离散化,而互信息的结果对离散化的方式很敏感
大信息系数克服了这两个问题。它首先寻找一种优的离散化方式,然后把互信息取值转换成一种度量方式,取值区间在[0,1]。minepy 提供了MIC功能。
反过头来看 y=x^2 这个例子,MIC算出来的互信息值为1(大的取值)。
为了处理定量数据,大信息系数法被提出,使用feature_selection库的SelectKBest类结合大信息系数法来 选择特征的代码如下:
from sklearn.feature_selection
import SelectKBest from minepy
import MINE

#由于MINE的设计不是函数式的,定义mic方法将其为函数式的,返回一个二元组,二元组的第2项设置成固定的P值0.5
def mic(x, y):
	m = MINE()
	m.compute_score(x, y)
	return (m.mic(), 0.5)
#选择K个好的特征,返回特征选择后的数据
SelectKBest(lambda X, Y: array(map(lambda x:mic(x, Y), X.T)).T,
k=2).fit_transform(iris.data, iris.target)

# --- 例子 --
from minepy
import MINE
m = MINE()
x = np.random.uniform(-1, 1, 10000)
m.compute_score(x, x**2)
print(m.mic())
# 1.0
3.1.4距离相关系数
- 距离相关系数是为了克服Pearson相关系数的弱点而生的。在x和x^2这个例子中,即便Pearson相关系数是0,我们也不能断定这两个变量是独立的(有可能是非线性相关);但如果距离相关系数是0,那么我们就可以说这两个变量是独立的。
- R的 energy 包里提供了距离相关系数的实现,另外这是 Python gist 的实现。
> x = runif (1000, -1, 1)
> dcor(x, x**2)
[1] 0.4943864
尽管有 MIC 和 距离相关系数在了,但当变量之间的关系接近线性相关的时候,Pearson相关系数仍然是不可替代 的
- 第一,Pearson相关系数计算速度快,这在处理大规模数据的时候很重要。
- 第二,Pearson相关系数的取值区间是[-1,1],而MIC和距离相关系数都是[0,1]。这个特点使得Pearson相关系数能够表征更丰富的关系,符号表示关系的正负,绝对值能够表示强度。当然,Pearson相关性有效的前提是两个变量的变化关系是单调的。
3.2Wrappper
- 包装法主要思想是:根据目标函数(通常是预测效果评分),每次选择若干特征,或者排除若干特征。
- 也可以将特征子集的选择看作是一个搜索寻优问题,生成不同的组合,对组合进行评价,再与其他的组合进行比较。
- 这样就将子集的选择看作是一个是一个优化问题,这里有很多的优化算法可以解决,尤其是一些启发式的优化算法,如GA,PSO,DE,ABC等,详见“优化算法—人工蜂群算法(ABC)”,“优化算法—粒子群算法(PSO)”。
3.2.1递归特征消除发
- 递归消除特征法使用一个基模型来进行多轮训练,每轮训练后,消除若干权值系数的特征,再基于新的特征集进行下一轮训练。使用feature_selection库的RFE类来选择特征的代码如下:
1 from sklearn.feature_selection import RFE
2 from sklearn.linear_model import LogisticRegression
3
4 #递归特征消除法,返回特征选择后的数据
5 #参数estimator为基模型
6 #参数n_features_to_select为选择的特征个数
7 RFE(estimator=LogisticRegression(), n_features_to_select=2).fit_transform(iris.data, iris.target)

# --- 例子,使用不同的基算法对特征的评估效果不一,注意选择--
from sklearn.svm import SVC from sklearn.datasets
import load_digits from sklearn.feature_selection
import RFE from sklearn.linear_model
import LogisticRegression
iris = load_iris()
x, y = iris.data, iris.target
svc = SVC(kernel="linear", C=1)
rfe = RFE(estimator=svc, n_features_to_select=2, step=1)
rfe.fit(x, y)
ranking = rfe.ranking_
print (ranking) # [3 2 1 1] 说明第三维度特征和第四维度特征排名前2

# 采用逻辑回归
ref2 = RFE(estimator=LogisticRegression(), n_features_to_select=2).fit(iris.data, iris.target)
print (ref2.ranking_)
# [3 1 2 1]  这里则选择认为第二维和第四维特征重要
3.3Embedded
- 嵌入法主要思想是:使用某些机器学习的算法和模型进行训练,得到各个特征的权值系数,根据系数从大到小选择特征。类似于Filter方法,但是是通过训练来确定特征的优劣。
- 其实是讲在确定模型的过程中,挑选出那些对模型的训练有重要意义的属性
3.3.1基于惩罚项的特征选择法
使用带惩罚项的基模型,除了筛选出特征外,同时也进行了降维。使用feature_selection库的SelectFromModel类结合带L1惩罚项的逻辑回归模型,来选择特征的代码如下:
1 from sklearn.feature_selection import SelectFromModel
2 from sklearn.linear_model import LogisticRegression
3
4 #带L1惩罚项的逻辑回归作为基模型的特征选择
5 SelectFromModel(LogisticRegression(penalty="l1", C=0.1)).fit_transform(iris.data, iris.target)

# --- 例子,这里用支持向量机了 --
from sklearn.svm import LinearSVC
from sklearn.datasets import load_iris
from sklearn.feature_selection
import SelectFromModel
iris = load_iris()
X, y = iris.data, iris.target
X.shape
# (150, 4)
lsvc = LinearSVC(C=0.01, penalty="l1", dual=False).fit(X,y)
# 这里的惩罚项是L1,别看做是11,这 里L是小写
model = SelectFromModel(lsvc, prefit=True)
X_new = model.transform(X) X_new[:3,:]
# 选取的前三行看一下
#array([[ 5.1,  3.5,  1.4],
#       [ 4.9,  3. ,  1.4],
#       [ 4.7,  3.2,  1.3]])
- L1惩罚项降维的原理在于保留多个对目标值具有同等相关性的特征中的一个,所以没选到的特征不代表不重要。故可结合L2惩罚项来优化。
- 具体操作为:若一个特征在L1中的权值为1,选择在L2中权值差别不大且在L1中权值为0的 特征构成同类集合,将这一集合中的特征平分L1中的权值,故需要构建一个新的逻辑回归模型:
from sklearn.linear_model
import LogisticRegression
class LR(LogisticRegression):
	def __init__(self, threshold=0.01, dual=False, tol=1e-4, C=1.0,
				fit_intercept=True, intercept_scaling=1, class_weight=None,
				random_state=None, solver='liblinear', max_iter=100,
				multi_class='ovr', verbose=0, warm_start=False, n_jobs=1):
    	#权值相近的阈值
    	self.threshold = threshold
    	LogisticRegression.__init__(self, penalty='l1', dual=dual, tol=tol, C=C,
    		fit_intercept=fit_intercept, intercept_scaling=intercept_scaling,
    		class_weight=class_weight,random_state=random_state, solver=solver, max_iter=max_iter,
    		multi_class=multi_class, verbose=verbose, warm_start=warm_start, n_jobs=n_jobs)
    	#使用同样的参数创建L2逻辑回归
    	self.l2 = LogisticRegression(penalty='l2', dual=dual,
    		tol=tol, C=C, fit_intercept=fit_intercept,
    		intercept_scaling=intercept_scaling, class_weight =
    		class_weight, random_state=random_state,
    		solver=solver, max_iter=max_iter,
    		multi_class=multi_class, verbose=verbose,
    		warm_start=warm_start, n_jobs=n_jobs)

    def fit(self, X, y, sample_weight=None):
    	#训练L1逻辑回归
    	super(LR, self).fit(X, y, sample_weight=sample_weight)
    	self.coef_old_ = self.coef_.copy()
    	#训练L2逻辑回归
    	self.l2.fit(X, y, sample_weight=sample_weight)

        cntOfRow, cntOfCol = self.coef_.shape
        #权值系数矩阵的行数对应目标值的种类数目
        for i in range(cntOfRow):
        	for j in range(cntOfCol):
        		coef = self.coef_[i][j]
        		#L1逻辑回归的权值系数不为0
        		if coef != 0:
        			idx = [j]
        			#对应在L2逻辑回归中的权值系数
        			  coef1 = self.l2.coef_[i][j]
        			  for k in range(cntOfCol):
        			  	coef2 = self.l2.coef_[i][k]
        			  	#在L2逻辑回归中,权值系数之差小于设定的阈值,且在L1中对应的权值为0
        			  	if abs(coef1-coef2) < self.threshold and j != k and self.coef_[i] [k] == 0:
        			  		idx.append(k)
        			  		#计算这一类特征的权值系数均值
        			  	mean = coef / len(idx)
        			  	self.coef_[i][idx] = me
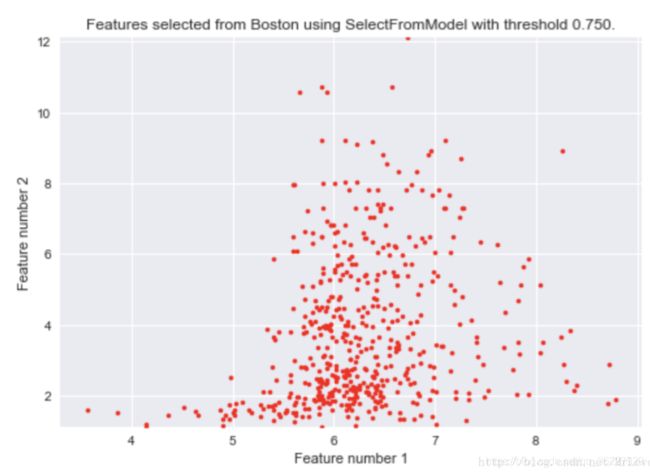
用feature_selection库的SelectFromModel类结合带L1以及L2惩罚项,设定阈值来进行特征的筛选
import matplotlib.pyplot as plt
import numpy as np
from sklearn.datasets import load_boston
from sklearn.feature_selection
import SelectFromModel
from sklearn.linear_model import LassoCV

# Load the boston dataset.
boston = load_boston()
X, y = boston.data, boston.target

# We use the base estimator LassoCV since the L1 norm promotes sparsity of features.
# 使用LassoCV来规范化使之稀疏化 clf = LassoCV()

# Set a minimum threshold of 0.25
sfm = SelectFromModel(clf, threshold=0.25)
n_features = sfm.fit_transform(X,y).shape[1]
# 初始满足阈值后留下的特征

# Reset the threshold till the number of features equals two.
# Note that the attribute can be set directly instead of repeatedly
# fitting the metatransformer.
# 开始不断的进行阈值攀升,直到有特征不满足被砍掉
while n_features > 2:
	sfm.threshold += 0.1
	X_transform = sfm.transform(X)
	n_features = X_transform.shape[1]

# Plot the selected two features from X.
plt.title(    "Features selected from Boston using
	SelectFromModel with "    "threshold %0.3f." % sfm.threshold)
feature1 = X_transform[:, 0]
feature2 = X_transform[:, 1]
plt.plot(feature1, feature2, 'r.')
plt.xlabel("Feature number 1")
plt.ylabel("Feature number 2")
plt.ylim([np.min(feature2), np.max(feature2)])
# ylim 设置y轴的范围
plt.show()
3.3.2基于树模型的特征选择法
树模型中GBDT可用来作为基模型进行特征选择,使用feature_selection库的SelectFromModel类结合GBDT模型,来选择特征的代码如下:
1 from sklearn.feature_selection import SelectFromModel
2 from sklearn.ensemble import GradientBoostingClassifier
3
4 #GBDT作为基模型的特征选择
5 SelectFromModel(GradientBoostingClassifier()).fit_transform(iris.data, iris.target)

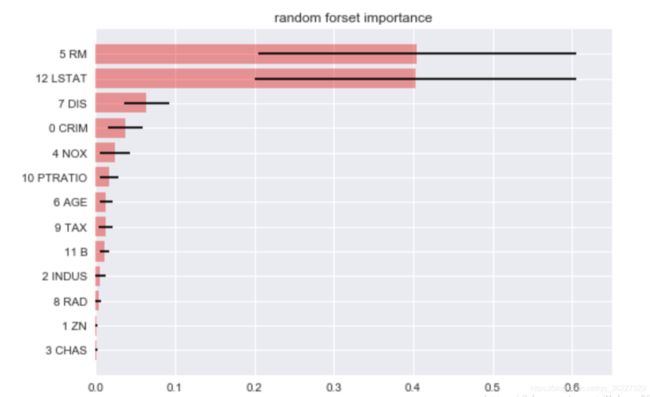
# --- 例子:这里用了随机森林了 ---
from sklearn.ensemble import RandomForestClassifier
from sklearn.datasets import load_iris
from sklearn.feature_selection import SelectFromModel
iris = load_iris()

X, y = iris.data, iris.target
X.shape
# (150, 4)
clf = RandomForestClassifier()
clf = clf.fit(X, y)
print clf.feature_importances_
# 显示每一个特征的重要性指标,越大说明越重要,可以看出,第三第四两个特 征比较重要
# [ 0.04505659  0.01056346  0.45428591  0.49009404]
model = SelectFromModel(clf, prefit=True)
X_new = model.transform(X)
X_new.shape
# (150, 2)

# 使用feature_importances_对boston数据的特征进行排序
from sklearn.ensemble import RandomForestRegressor
x, y = boston.data, boston.target
feature_name = np.array(["%d %s"%(b,a) for a,b in
	zip(boston.feature_names,range(len(boston.feature_names)))])
rf = RandomForestRegressor(n_estimators=100, random_state=101).fit(x,y)
importance = np.mean([tree.feature_importances_ for tree in rf.estimators_], axis=0)
std = np.std([ tree.feature_importances_ for tree in rf.estimators_],axis=0)
indices = np.argsort(importance)
range_ = range(len(importance))

plt.figure()
plt.title("random forset importance")
plt.barh(range_, importance[indices],color='r',xerr=std[indices],alpha=0.4,align='center')
plt.yticks(range(len(importance)),feature_name[indices]) plt.ylim([-1,len(importance)])
plt.xlim([0.0,0.65])
plt.show()
总结
| 类 | 所属方式 | 说明 |
|---|---|---|
| VarianceThreshold | Filter | 方差选择法 |
| SelectKBest | Filter | 可选关联系 数、卡方校验、大信息系数作为得分计算的方法 |
| RFE | Wrapper | 递归地训练基模型,将权值系数较小的特征从特征集合中消除 |
| SelectFromModel | Embedded | 训练基模型,选择权值系数较高的特征 |
4.降维
- 当特征选择完成后,可以直接训练模型了,但是可能由于特征矩阵过大,导致计算量大,训练时间长的问题,因此降 低特征矩阵维度也是必不可少的。
- 常见的降维方法除了以上提到的基于L1惩罚项的模型以外,另外还有主成分分析法 (PCA)和线性判别分析(LDA),线性判别分析本身也是一个分类模型。
- PCA和LDA有很多的相似点,其本质是要 将原始的样本映射到维度更低的样本空间中,但是PCA和LDA的映射目标不一样:PCA是为了让映射后的样本具有最 大的发散性;而LDA是为了让映射后的样本有最好的分类性能。
- 所以说PCA是一种无监督的降维方法,而LDA是一种 有监督的降维方法。
4.1主成分分析法(PAC)
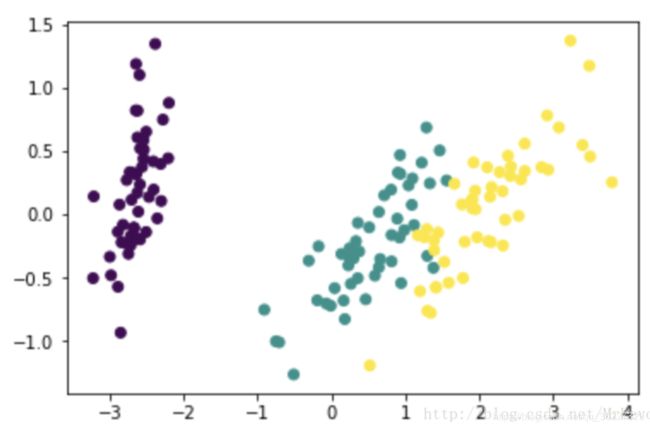
使用decomposition库的PCA类选择特征的代码如下:
1 from sklearn.decomposition import PCA
2
3 #主成分分析法,返回降维后的数据
4 #参数n_components为主成分数目
5 PCA(n_components=2).fit_transform(iris.data)

# --- 例子 ---
from sklearn.decomposition import PCA,KernelPCA
import pandas as pd
import numpy as np
import matplotlib.pyplot as plt
from sklearn.datasets import
load_iris iris_data = load_iris()
category = pd.Categorical(iris_data.target)
# 将标签进行量化,就是说本来都是字符串啊,但是后计算的 时候都需要量化成1,2,3类等

pca_2c = PCA(n_components=2)
# 使用PCA降到2维
#pca_2c = KernelPCA(n_components=2)

x_pca_2c = pca_2c.fit_transform(iris_data.data)
x_pca_2c.shape
plt.scatter(x_pca_2c[:,0],x_pca_2c[:,1],c=category.codes)
plt.show()
4.2线性判别分析法(LDA)
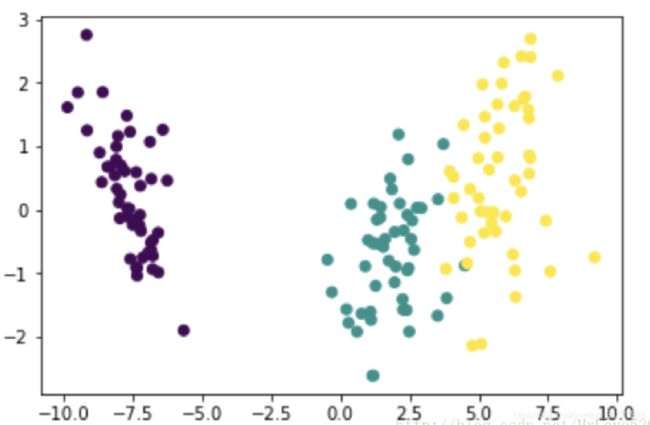
使用LDA进行降维的代码如下:
1 from sklearn.discriminant_analysis import LinearDiscriminantAnalysis as LDA
2
3 #线性判别分析法,返回降维后的数据
4 #参数n_components为降维后的维数
5 LDA(n_components=2).fit_transform(iris.data, iris.target)

# --- 例子 ---
# LDA相较于pca是有监督的,但不能用于回归分析
from sklearn.lda import LDA
import pandas as pd
import numpy as np
import matplotlib.pyplot as plt
from sklearn.datasets import  load_iris
iris_data = load_iris()
category = pd.Categorical(iris_data.target)
# 将标签进行量化,就是说本来都是字符串啊,但是后计算的 时候都需要量化成1,2,3类等

lda_2c = LDA(n_components=2)
x_pca_2c = lda_2c.fit_transform(iris_data.data,iris_data.target)
x_pca_2c.shape
plt.scatter(x_pca_2c[:,0],x_pca_2c[:,1],c=category.codes)
plt.show()
总结
| 库 | 类 | 说明 |
|---|---|---|
| decomposition | PCA | 主成分分析法 |
| lda | LDA | 线性判别分析法 |
