import pandas as pd
import numpy as np
import talib as ta
import tushare as ts
import matplotlib.pyplot as plt
from matplotlib import rc
rc('mathtext', default='regular')
import seaborn as sns
sns.set_style('white')
from matplotlib import dates
import matplotlib as mpl
plt.rcParams["figure.figsize"] = (20,10)
dw = ts.get_k_data("600600")
dw = dw[300:]
dw.index = range(len(dw))
dw['slowk'], dw['slowd'] = ta.STOCH(dw['high'].values,
dw['low'].values,
dw['close'].values,
fastk_period=9,
slowk_period=3,
slowk_matype=0,
slowd_period=3,
slowd_matype=0)
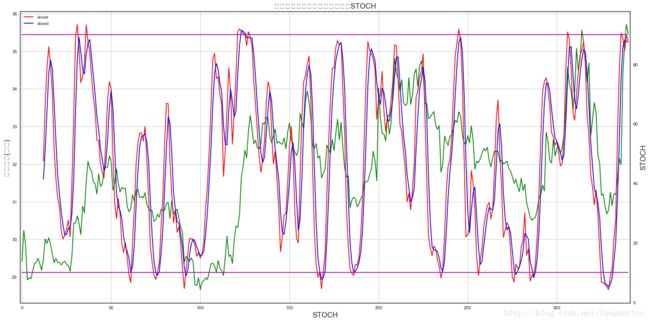
fig = plt.figure(figsize=(20,10))
fig.set_tight_layout(True)
ax1 = fig.add_subplot(111)
ax1.plot(dw.index, dw.close, '-', color='g')
ax2 =ax1.twinx()
ax2.plot(dw.index, dw.slowk, '-', color='r')
ax2.plot(dw.index, dw.slowd, '-', color='b')
ax2.plot(dw.index, [90]*len(dw), '-', color='m')
ax2.plot(dw.index, [10]*len(dw), '-', color='m')
ax1.set_ylabel(u"股票价格(绿色)", fontsize=16)
ax2.set_ylabel(u"STOCH", fontsize=16)
ax1.set_title(u"绿色是股票价格,红色(右轴)STOCH", fontsize=16)
ax1.set_xlabel(u"STOCH",fontsize=16)
ax1.set_xlim(left=-1,right=len(dw))
ax1.grid()
plt.legend(loc='upper left')

