R基础(读入数据与可视化)
https://cran.rstudio.com/
下载并安装 R 编程语言。
安装完成 R 后,你可以从 http://www.rstudio.com 下载并安装 RStudio。
在控制台中输入以下命令,在每一行之后按 Enter 或 Return 键: install.packages("swirl") library(swirl) swirl()
在 R 中运行以下代码,获得其他主题。 install.packages('ggthemes', dependencies = TRUE) library(ggthemes)
你需要安装并加载 knitr 包,以便使用 KNIT HTML 按钮。在 RStudio 控制台中运行以下命令,以安装并加载 knitr。
install.packages('knitr', dependencies = T)
library(knitr)
要运行 qplot 函数,你必须安装并加载 ggplot2 库。你可以运行这两行代码来这样做。
install.packages('ggplot2', dependencies = T) library(ggplot2)
安装 XQuartz,然后运行以下代码:
install.packages('devtools', dependencies = T) library(devtools) install_version("colorspace","1.2-4")
现在,你应该可以在 RStudio 中加载 ggplot2 了。
创建所有三个直方图之前,你需要运行以下代码: install.packages('gridExtra') library(gridExtra)
注意:每一行开头的 > 符号是 R 的提示符,提示你向控制台中输入信息。我们在此处提及这一点,是想告诉你以上的命令只能在控制台中输入。你输入的部分从 > 之后开始。
getwd()
#setwd()设置当前目录
statesInfo <- read.csv('stateData.csv')
subset(statesInfo,state.region ==1)
statesInfo[statesInfo$state.region ==1, ]
#后面不加限定的列表示返回第一个条件的所有列
numbers <- c(1:10)
numbers
numbers <- c(numbers, 11:20)
numbers
udacious <- c("Chris Saden", "Lauren Castellano",
"Sarah Spikes","Dean Eckles",
"Andy Brown", "Moira Burke",
"Kunal Chawla", "YOUR_NAME")
mystery = nchar(udacious)
mystery
> mystery
[1] 11 17 12 11 10 11 12 9
> mystery = nchar(udacious)
> mystery
[1] 11 17 12 11 10 11 12 9
> mystery == 11
[1] TRUE FALSE FALSE TRUE FALSE TRUE FALSE FALSE
> udacious[mystery == 11]
[1] "Chris Saden" "Dean Eckles" "Moira Burke"
> data(mtcars)
> names(mtcars)
[1] "mpg" "cyl" "disp" "hp" "drat" "wt" "qsec" "vs" "am" "gear" "carb"
> ?mtcars
> mtcars
mpg cyl disp hp drat wt qsec vs am gear carb
Mazda RX4 21.0 6 160.0 110 3.90 2.620 16.46 0 1 4 4
Mazda RX4 Wag 21.0 6 160.0 110 3.90 2.875 17.02 0 1 4 4
Datsun 710 22.8 4 108.0 93 3.85 2.320 18.61 1 1 4 1
Hornet 4 Drive 21.4 6 258.0 110 3.08 3.215 19.44 1 0 3 1
Hornet Sportabout 18.7 8 360.0 175 3.15 3.440 17.02 0 0 3 2
Valiant 18.1 6 225.0 105 2.76 3.460 20.22 1 0 3 1
Duster 360 14.3 8 360.0 245 3.21 3.570 15.84 0 0 3 4
Merc 240D 24.4 4 146.7 62 3.69 3.190 20.00 1 0 4 2
Merc 230 22.8 4 140.8 95 3.92 3.150 22.90 1 0 4 2
Merc 280 19.2 6 167.6 123 3.92 3.440 18.30 1 0 4 4
Merc 280C 17.8 6 167.6 123 3.92 3.440 18.90 1 0 4 4
Merc 450SE 16.4 8 275.8 180 3.07 4.070 17.40 0 0 3 3
Merc 450SL 17.3 8 275.8 180 3.07 3.730 17.60 0 0 3 3
Merc 450SLC 15.2 8 275.8 180 3.07 3.780 18.00 0 0 3 3
Cadillac Fleetwood 10.4 8 472.0 205 2.93 5.250 17.98 0 0 3 4
Lincoln Continental 10.4 8 460.0 215 3.00 5.424 17.82 0 0 3 4
Chrysler Imperial 14.7 8 440.0 230 3.23 5.345 17.42 0 0 3 4
Fiat 128 32.4 4 78.7 66 4.08 2.200 19.47 1 1 4 1
Honda Civic 30.4 4 75.7 52 4.93 1.615 18.52 1 1 4 2
Toyota Corolla 33.9 4 71.1 65 4.22 1.835 19.90 1 1 4 1
Toyota Corona 21.5 4 120.1 97 3.70 2.465 20.01 1 0 3 1
Dodge Challenger 15.5 8 318.0 150 2.76 3.520 16.87 0 0 3 2
AMC Javelin 15.2 8 304.0 150 3.15 3.435 17.30 0 0 3 2
Camaro Z28 13.3 8 350.0 245 3.73 3.840 15.41 0 0 3 4
Pontiac Firebird 19.2 8 400.0 175 3.08 3.845 17.05 0 0 3 2
Fiat X1-9 27.3 4 79.0 66 4.08 1.935 18.90 1 1 4 1
Porsche 914-2 26.0 4 120.3 91 4.43 2.140 16.70 0 1 5 2
Lotus Europa 30.4 4 95.1 113 3.77 1.513 16.90 1 1 5 2
Ford Pantera L 15.8 8 351.0 264 4.22 3.170 14.50 0 1 5 4
Ferrari Dino 19.7 6 145.0 175 3.62 2.770 15.50 0 1 5 6
Maserati Bora 15.0 8 301.0 335 3.54 3.570 14.60 0 1 5 8
Volvo 142E 21.4 4 121.0 109 4.11 2.780 18.60 1 1 4 2
> str(mtcars)
'data.frame': 32 obs. of 11 variables:
$ mpg : num 21 21 22.8 21.4 18.7 18.1 14.3 24.4 22.8 19.2 ...
$ cyl : num 6 6 4 6 8 6 8 4 4 6 ...
$ disp: num 160 160 108 258 360 ...
$ hp : num 110 110 93 110 175 105 245 62 95 123 ...
$ drat: num 3.9 3.9 3.85 3.08 3.15 2.76 3.21 3.69 3.92 3.92 ...
$ wt : num 2.62 2.88 2.32 3.21 3.44 ...
$ qsec: num 16.5 17 18.6 19.4 17 ...
$ vs : num 0 0 1 1 0 1 0 1 1 1 ...
$ am : num 1 1 1 0 0 0 0 0 0 0 ...
$ gear: num 4 4 4 3 3 3 3 4 4 4 ...
$ carb: num 4 4 1 1 2 1 4 2 2 4 ...
> dim(mtcars)
[1] 32 11
> # 10. Read the documentation for row.names if you're want to know more.
> ?row.names
> # Run this code to see the current row names in the data frame.
> row.names(mtcars)
[1] "Mazda RX4" "Mazda RX4 Wag" "Datsun 710" "Hornet 4 Drive"
[5] "Hornet Sportabout" "Valiant" "Duster 360" "Merc 240D"
[9] "Merc 230" "Merc 280" "Merc 280C" "Merc 450SE"
[13] "Merc 450SL" "Merc 450SLC" "Cadillac Fleetwood" "Lincoln Continental"
[17] "Chrysler Imperial" "Fiat 128" "Honda Civic" "Toyota Corolla"
[21] "Toyota Corona" "Dodge Challenger" "AMC Javelin" "Camaro Z28"
[25] "Pontiac Firebird" "Fiat X1-9" "Porsche 914-2" "Lotus Europa"
[29] "Ford Pantera L" "Ferrari Dino" "Maserati Bora" "Volvo 142E"
> # Run this code to change the row names of the cars to numbers.
> row.names(mtcars) <- c(1:32)
> # Now print out the data frame by running the code below.
> mtcars
mpg cyl disp hp drat wt qsec vs am gear carb
1 21.0 6 160.0 110 3.90 2.620 16.46 0 1 4 4
2 21.0 6 160.0 110 3.90 2.875 17.02 0 1 4 4
3 22.8 4 108.0 93 3.85 2.320 18.61 1 1 4 1
4 21.4 6 258.0 110 3.08 3.215 19.44 1 0 3 1
5 18.7 8 360.0 175 3.15 3.440 17.02 0 0 3 2
6 18.1 6 225.0 105 2.76 3.460 20.22 1 0 3 1
7 14.3 8 360.0 245 3.21 3.570 15.84 0 0 3 4
8 24.4 4 146.7 62 3.69 3.190 20.00 1 0 4 2
9 22.8 4 140.8 95 3.92 3.150 22.90 1 0 4 2
10 19.2 6 167.6 123 3.92 3.440 18.30 1 0 4 4
11 17.8 6 167.6 123 3.92 3.440 18.90 1 0 4 4
12 16.4 8 275.8 180 3.07 4.070 17.40 0 0 3 3
13 17.3 8 275.8 180 3.07 3.730 17.60 0 0 3 3
14 15.2 8 275.8 180 3.07 3.780 18.00 0 0 3 3
15 10.4 8 472.0 205 2.93 5.250 17.98 0 0 3 4
16 10.4 8 460.0 215 3.00 5.424 17.82 0 0 3 4
17 14.7 8 440.0 230 3.23 5.345 17.42 0 0 3 4
18 32.4 4 78.7 66 4.08 2.200 19.47 1 1 4 1
19 30.4 4 75.7 52 4.93 1.615 18.52 1 1 4 2
20 33.9 4 71.1 65 4.22 1.835 19.90 1 1 4 1
21 21.5 4 120.1 97 3.70 2.465 20.01 1 0 3 1
22 15.5 8 318.0 150 2.76 3.520 16.87 0 0 3 2
23 15.2 8 304.0 150 3.15 3.435 17.30 0 0 3 2
24 13.3 8 350.0 245 3.73 3.840 15.41 0 0 3 4
25 19.2 8 400.0 175 3.08 3.845 17.05 0 0 3 2
26 27.3 4 79.0 66 4.08 1.935 18.90 1 1 4 1
27 26.0 4 120.3 91 4.43 2.140 16.70 0 1 5 2
28 30.4 4 95.1 113 3.77 1.513 16.90 1 1 5 2
29 15.8 8 351.0 264 4.22 3.170 14.50 0 1 5 4
30 19.7 6 145.0 175 3.62 2.770 15.50 0 1 5 6
31 15.0 8 301.0 335 3.54 3.570 14.60 0 1 5 8
32 21.4 4 121.0 109 4.11 2.780 18.60 1 1 4 2
> data(mtcars)
> head(mtcars, 10)
mpg cyl disp hp drat wt qsec vs am gear carb
Mazda RX4 21.0 6 160.0 110 3.90 2.620 16.46 0 1 4 4
Mazda RX4 Wag 21.0 6 160.0 110 3.90 2.875 17.02 0 1 4 4
Datsun 710 22.8 4 108.0 93 3.85 2.320 18.61 1 1 4 1
Hornet 4 Drive 21.4 6 258.0 110 3.08 3.215 19.44 1 0 3 1
Hornet Sportabout 18.7 8 360.0 175 3.15 3.440 17.02 0 0 3 2
Valiant 18.1 6 225.0 105 2.76 3.460 20.22 1 0 3 1
Duster 360 14.3 8 360.0 245 3.21 3.570 15.84 0 0 3 4
Merc 240D 24.4 4 146.7 62 3.69 3.190 20.00 1 0 4 2
Merc 230 22.8 4 140.8 95 3.92 3.150 22.90 1 0 4 2
Merc 280 19.2 6 167.6 123 3.92 3.440 18.30 1 0 4 4
> # The head() function prints out the first six rows of a data frame
> # by default. Run the code below to see.
> head(mtcars)
mpg cyl disp hp drat wt qsec vs am gear carb
Mazda RX4 21.0 6 160 110 3.90 2.620 16.46 0 1 4 4
Mazda RX4 Wag 21.0 6 160 110 3.90 2.875 17.02 0 1 4 4
Datsun 710 22.8 4 108 93 3.85 2.320 18.61 1 1 4 1
Hornet 4 Drive 21.4 6 258 110 3.08 3.215 19.44 1 0 3 1
Hornet Sportabout 18.7 8 360 175 3.15 3.440 17.02 0 0 3 2
Valiant 18.1 6 225 105 2.76 3.460 20.22 1 0 3 1
> # I think you'll know what this does.
> tail(mtcars, 3)
mpg cyl disp hp drat wt qsec vs am gear carb
Ferrari Dino 19.7 6 145 175 3.62 2.77 15.5 0 1 5 6
Maserati Bora 15.0 8 301 335 3.54 3.57 14.6 0 1 5 8
Volvo 142E 21.4 4 121 109 4.11 2.78 18.6 1 1 4 2
> mtcars$mpg
[1] 21.0 21.0 22.8 21.4 18.7 18.1 14.3 24.4 22.8 19.2 17.8 16.4 17.3 15.2 10.4 10.4 14.7 32.4 30.4
[20] 33.9 21.5 15.5 15.2 13.3 19.2 27.3 26.0 30.4 15.8 19.7 15.0 21.4
> mean(mtcars$mpg)
[1] 20.09062
下面两个命令相等
subset(mtcars, mpg >=30 | hp <60)
mtcars[mtcars$mpg >=30 | mtcars$hp <60, ]
在 {r} 代码块的内部和外部使用 “pound sign/key”或称 "hash sign/key" # 会有所不同。
```{r}
# r 块中的 # (pound / hash sign) 会创建
# 注释。这三行不是代码,因此不能被 # 执行。
x <- [1:10]
mean(x)
```
如果你在 {r} 代码块外部使用 # 符号,你可以创建文本头。
reddit <- read.csv('reddit.csv')
str(reddit)
table(reddit$employment.status)
summary(reddit)
levels(reddit$age.range)
qplot(data=reddit,x=age.range)
qplot(data=reddit,x=income.range)
reddit$age.range <- factor(reddit$age.range,levels=c("Under 18",'18-24', "25-34", "35-44" , "45-54" , "55-64" , "65 or Above"),ordered=T)
levels(reddit$income.range)
reddit$income.range <- factor(reddit$income.range,levels=c("Under $20,000","$20,000 - $29,999", "$30,000 - $39,999", "$40,000 - $49,999" , "$50,000 - $69,999" , "$70,000 - $99,999" , "$100,000 - $149,999","$150,000 or more" ),ordered=T)
加载伪 Facebook 数据。
read.delim('pseudo_facebook.tsv')
read.delim() 函数默认使用制表符作为值之间的分隔符,并使用句点作为十进制字符。在控制台中运行 ?read.csv 或 ?read.delim 以了解更多信息。
getwd()
list.files()
pf <-read.delim('pseudo_facebook.tsv')
names(pf)
ggthemes 包由 Jeffery Arnold 开发
Chris 使用的是 theme_minimal(),字体大小为 24,所以他的输出可能会和你的有些许不同。你可以在 R 中使用以下代码使用和 Chris 一样的主题。当然你也可以使用自己的主题。 theme_set(theme_minimal(24))
除了 qplot() 函数,你也可以使用 ggplot() 函数创建直方图: ggplot(aes(x = dob_day), data = pf) +
geom_histogram(binwidth = 1) +
scale_x_continuous(breaks = 1:31)
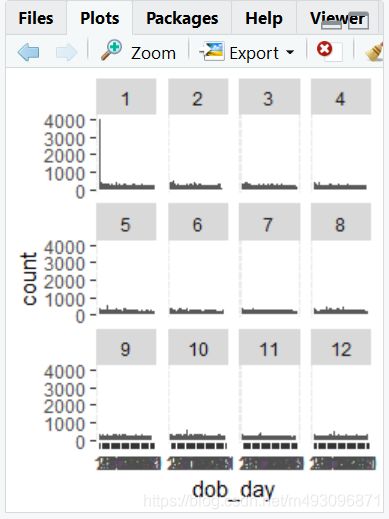
注册帐号时,很多网站会将你的生日默认为1号,甚至1月1号。对于 Facebook,他们的默认是1月1日。
在探索数据时,留心这样的细节非常重要。
qplot(x=dob_day,data = pf)
ggplot(aes(x = dob_day), data = pf) +geom_histogram(binwidth = 1) +scale_x_continuous(breaks = 1:31)
ggplot(data = pf, aes(x = dob_day)) +
geom_histogram(binwidth = 1) +
scale_x_continuous(breaks = 1:31) +
facet_wrap(~dob_month)
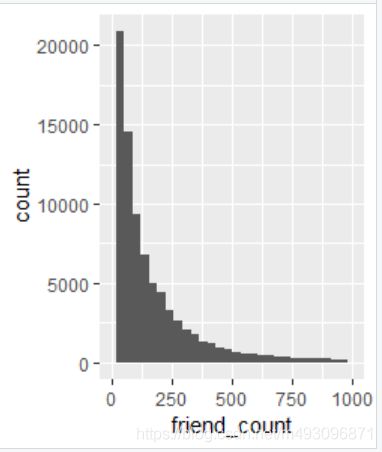
ggplot(aes(x = friend_count), data = pf) +
geom_histogram()
ggplot(aes(x = friend_count), data = pf) +
geom_histogram() +
scale_x_continuous(limits = c(0, 1000))
ggplot(aes(x = friend_count), data = pf) +
geom_histogram(binwidth = 25) +
scale_x_continuous(limits = c(0, 1000), breaks = seq(0, 1000, 50))
qplot(x = friend_count, data = pf, binwidth = 25) +
scale_x_continuous(limits = c(0, 1000), breaks = seq(0, 1000, 50))
qplot(x = friend_count, data = pf) +
facet_grid(. ~ gender)
等效的 ggplot 语法: qplot(x = friend_count, data = pf) +
facet_grid(. ~ gender)
ggplot(aes(x = friend_count), data = pf) +
geom_histogram() +
scale_x_continuous(limits = c(0, 1000), breaks = seq(0, 1000, 50)) +
facet_wrap(~gender)
等效的 ggplot 语法: ggplot(aes(x = friend_count), data = subset(pf, !is.na(gender))) +
geom_histogram() +
scale_x_continuous(limits = c(0, 1000), breaks = seq(0, 1000, 50)) +
facet_wrap(~gender)
> table(pf$gender)
female male
40254 58574
> by(pf$friend_count,pf$gender,summary)
pf$gender: female
Min. 1st Qu. Median Mean 3rd Qu. Max.
0 37 96 242 244 4923
--------------------------------------------------------------------------
pf$gender: male
Min. 1st Qu. Median Mean 3rd Qu. Max.
0 27 74 165 182 4917
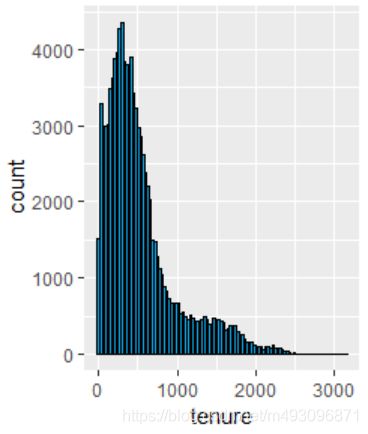
等效的 ggplot 语法: ggplot(aes(x = tenure), data = pf) +
geom_histogram(binwidth = 30, color = 'black', fill = '#099DD9')
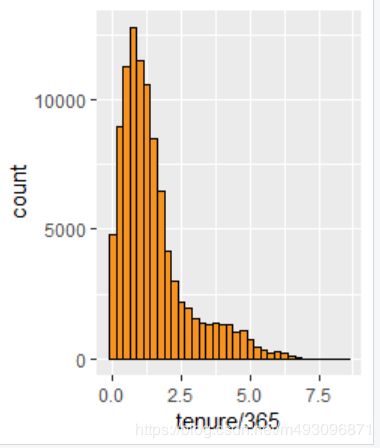
等效的 ggplot 语法: ggplot(aes(x = tenure/365), data = pf) +
geom_histogram(binwidth = .25, color = 'black', fill = '#F79420')
ggplot(aes(x = tenure/365), data = pf) +
geom_histogram(binwidth = .25, color = 'black', fill = '#F79420')
ggplot(aes(x = tenure), data = pf) +
geom_histogram(binwidth = 30, color = 'black', fill = '#099DD9')
参数 color 决定了图中对象的轮廓线颜色(color outline)。
参数 fill 决定了图中对象内的区域(area)颜色。
你可能注意到颜色 black 和十六进制代码的颜色 #099DD9(一种蓝色阴影)如何封装在 I() 内。I() 函数代表“现状”,并且告诉 qplot 将它们用作颜色。
ggplot(aes(x = tenure / 365), data = pf) +
   geom_histogram(color = 'black', fill = '#F79420') +
   scale_x_continuous(breaks = seq(1, 7, 1), limits = c(0, 7)) +
   xlab('Number of years using Facebook') +
   ylab('Number of users in sample')
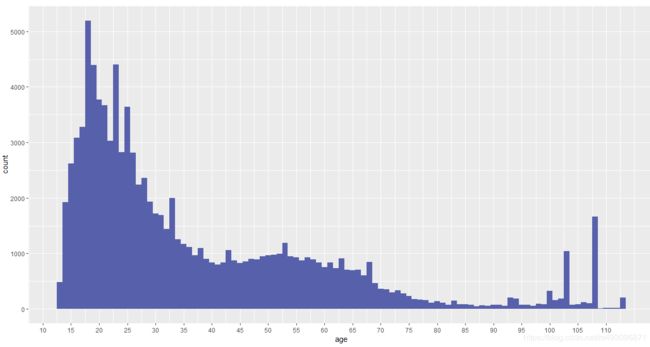
ggplot(aes(x = age), data = pf) +
geom_histogram(binwidth = 1, fill = '#5760AB') +
scale_x_continuous(breaks = seq(0, 113, 5))
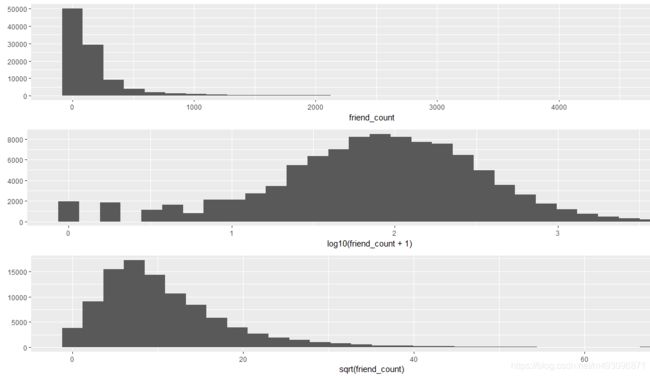
p1<-qplot(x=friend_count,data=pf)
p2<-qplot(x=log10(friend_count+1),data=pf)
p3<-qplot(x=sqrt(friend_count),data=pf)
grid.arrange(p1,p2,p3,ncol=1)
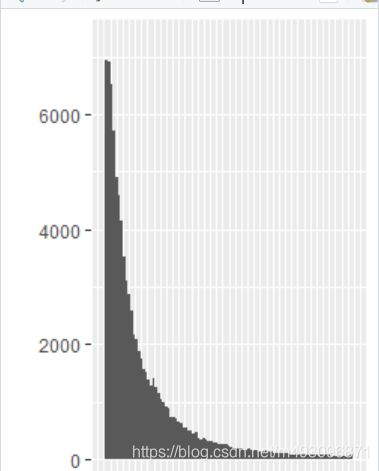
ggplot(aes(x = friend_count), data = pf) + scale_x_log10()
logScale <- qplot(x=log10(friend_count+1),data=pf)
countScale<-ggplot(aes(x = friend_count), data = pf) +geom_histogram() +scale_x_log10()
grid.arrange(logScale,countScale,ncol=2)
qplot(x=log10(friend_count+1),data=pf)+scale_x_log10()
qplot(x=friend_count,data=subset(pf,!is.na(gender)),binwidth=10)+
scale_x_continuous(lim=c(0,1000),breaks=seq(0,1000,50))
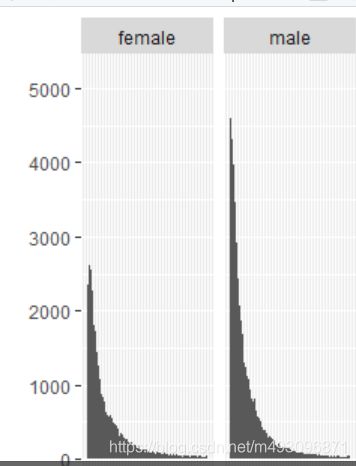
qplot(x=friend_count,data=subset(pf,!is.na(gender)),binwidth=10)+
scale_x_continuous(lim=c(0,1000),breaks=seq(0,1000,50)) + facet_wrap(~gender)
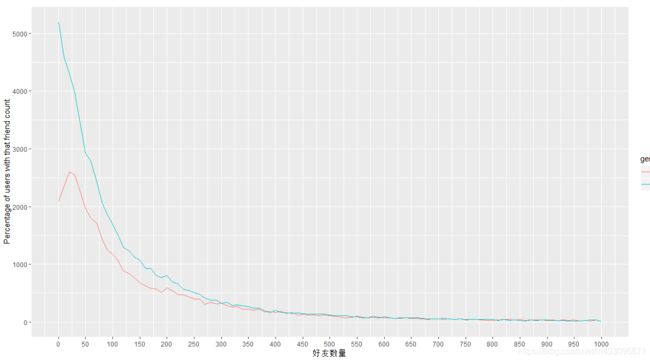
显示频率多边形图
qplot(x=friend_count,data=subset(pf,!is.na(gender)),
binwidth=10,geom='freqpoly',color=gender)+
scale_x_continuous(lim=c(0,1000),breaks=seq(0,1000,50)) +
xlab('好友数量') +
ylab('Percentage of users with that friend count')
等效的 ggplot 语法: ggplot(aes(x = www_likes), data = subset(pf, !is.na(gender))) +
geom_freqpoly(aes(color = gender)) +
scale_x_log10()
by(pf$www_likes,pf$gender,sum)
pf$gender: female
[1] 3507665
---------------------------------------------------------------------------
pf$gender: male
[1] 1430175
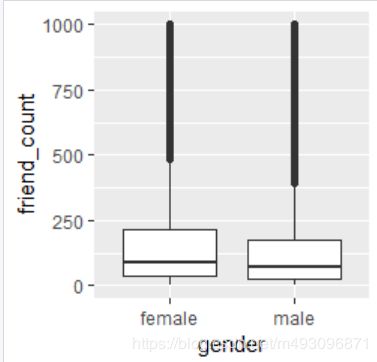
qplot(x=gender,y=friend_count,data=subset(pf,!is.na(gender)),geom='boxplot')
下面两个命令相等
qplot(x=gender,y=friend_count,
data=subset(pf,!is.na(gender)),
geom='boxplot',ylim = c(0,1000))
qplot(x=gender,y=friend_count,
data=subset(pf,!is.na(gender)),
geom='boxplot')+
scale_y_continuous(limits = c(0,1000))
qplot(x=gender,y=friend_count,
data=subset(pf,!is.na(gender)),
geom='boxplot')+
coord_cartesian(ylim=c(0,100))
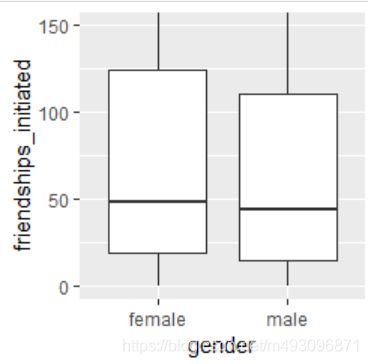
qplot(x=gender,y=friendships_initiated,
data=subset(pf,!is.na(gender)),
geom='boxplot')+
coord_cartesian(ylim=c(0,150))
qplot(x=gender,y=friendships_initiated,
data=subset(pf,!is.na(gender)),
geom='boxplot')+
coord_cartesian(ylim=c(0,150))
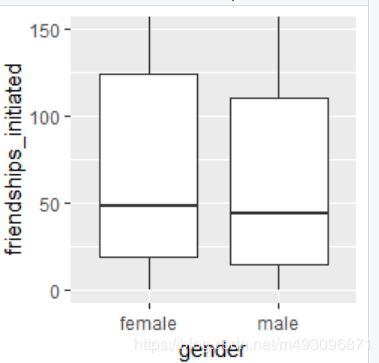
by(pf$friendships_initiated,pf$gender,summary)
by(pf$friendships_initiated,pf$gender,summary)
pf$gender: female
Min. 1st Qu. Median Mean 3rd Qu. Max.
0.0 19.0 49.0 113.9 124.8 3654.0
---------------------------------------------------------------------------
pf$gender: male
Min. 1st Qu. Median Mean 3rd Qu. Max.
0.0 15.0 44.0 103.1 111.0 4144.0
由于 mobile_check_in 是一个因子变量,因此 sum() 函数将无法运行。你可以使用 length() 函数来确定向量中的值数量。
我们还可以创建 mobile_check_in 来保存布尔值。sum() 函数可处理布尔值(true 为 1,false 为 0)。
> mobile_check_in <- NA
> pf$mobile_check_in <- ifelse(pf$mobile_likes > 0,1,0)
> pf$mobile_check_in <- factor(pf$mobile_check_in)
> summary(pf$mobile_check_in)
0 1
35056 63947
> sum(pf$mobile_check_in==1)/length(pf$mobile_check_in)
[1] 0.6459097

