成都二手房市场分析
文章目录
- 成都二手房市场分析
- 数据概览&整理
- 数据分析
- 1.字段概览
- 2. 成交量
- 3.成交价
- 4.小区分析
成都二手房市场分析
数据爬取自某市场份额较大的中介,基本上能代表整个成都二手房交易状况。
数据概览&整理
数据主要由2张表格构成: houseDetail.csv, 已成交房屋详细信息(18万条+)和 blockDetail.csv, 已成交房屋小区详细信息(7千条+)。
先看下数据长啥样。
df = pd.read_csv('houseDetail.csv', index_col='houseID', dtype={'houseID':str,'listedDays':str,'listedPrice':str, 'listedTime':str})
print(df.shape)
df.head(1)
(185950, 34)
| agent | agentID | area | blockID | browses | buildingStructure | buildingType | builtYear | dealHouseTxt | dealedTime | decoration | district | elevator_units | feature | floor | follows | hasElevator | listedDays | listedPrice | listedTime | orientation | ownership | priceAjustment | pricePerMetre | propertyYear | title | totalPrice | transactionType | transactionYear | unitStructure | unitType | unitUsage | usableArea | visits | |
|---|---|---|---|---|---|---|---|---|---|---|---|---|---|---|---|---|---|---|---|---|---|---|---|---|---|---|---|---|---|---|---|---|---|---|
| houseID | ||||||||||||||||||||||||||||||||||
| 106101478810 | 史于竹 | 1000000023028484 | 34.64㎡ | 1611047665350 | 603 | 钢结构 | 板塔结合 | 2008 | NaN | 2018.09.28 | 其他 | shawanhuizhan | 四梯八十五户 | 锦西国际是一个住宅小区 水电气三通民用 需要有购房资质才能购买 此小区1栋1单元4梯67户 ... | 高楼层(共22层) | 7 | 有 | 50 | 71.5 | 2018-08-10 | 南 | 暂无数据 | 1 | 20641 | 70年 | 锦西国际 | 71.5 | 商品房 | 暂无数据 | 跃层 | 2室1厅1厨1卫 | 普通住宅 | 暂无数据 | 0 |
blockDetail_df = pd.read_csv('blockDetail.csv', index_col='blockID', dtype={'blockID':str})
print(blockDetail_df.shape)
blockDetail_df.head(3)
(7222, 10)
| PMC | address | buildingTypes | buildingsNum | builtYear | coordinate | developer | fee | title | unitsNum | |
|---|---|---|---|---|---|---|---|---|---|---|
| blockID | ||||||||||
| 1611047665350 | 四川博鑫物业管理有限公司 | (金牛沙湾)圃园北路1号 | 塔楼/塔板结合 | 1栋 | 2008年建成 | 104.06200416,30.70025532 | 四川名人房地产开发有限责任公司 | 1.8元/平米/月 | 锦西国际 | 1788户 |
| 1611061495762 | 单位自管物业 | (金牛沙湾)沙湾路71号 | 板楼 | 4栋 | 1998年建成 | 104.058682,30.699298 | 无开发商 | 0.5元/平米/月 | 沙湾路71号 | 175户 |
| 3011055272967 | 成都世纪城物业管理有限公司 | (金牛沙湾)金沙路169号 | 塔楼 | 7栋 | 2014年建成 | 104.053015,30.697927 | 成都国际会议展览中心 | 2至6元/平米/月 | 现代城 | 2433户 |
houseDetail 一共有185950行, 34列。blockDetail一共7222行,10列。数据类型基本都是字符串,需要做一些整理。
# 将面积转成float型。其他字段类似的作相应处理
def areaClean(df):
    area = df.area
    if area=='' or area=='暂无数据':
        return -1
    else:
        return float(area[0:-1])

df['area'] = df.apply(areaClean, axis=1)

df['dealedTime'] = pd.to_datetime(df.dealedTime)
df.sort_values(by=['dealedTime', 'listedTime'], inplace=True)
数据分析
1.字段概览
- 房屋建筑面积
print('area\n', df.area.describe())
area
count 185950.000000
mean 92.011252
std 39.212880
min 8.000000
25% 67.250000
50% 87.000000
75% 111.660000
max 877.530000
最大的有800多平。
- 挂牌价
print('listedPrice\n', df.listedPrice.describe())
listedPrice
count 185950.000000
mean 85.652573
std 76.763219
min -1.000000
25% 42.000000
50% 77.000000
75% 117.000000
max 2750.000000
挂牌价均值85万,最高的是2750万
- 电梯
print('hasElvevator\n', df.hasElevator.value_counts())
hasElvevator
1 143898
0 34859
-1 7193
77%都是电梯房。
- 房屋距上次交易满了几年
print('transactionYear\n', df.transactionYear.value_counts())
transactionYear
-1 148967
5 18607
2 18376
满了5年/2年的各占约10%,其他的未知。
- 户型结构
print('unitStructure\n', df.unitStructure.value_counts())
unitStructure
-1 132101
平层 50938
跃层 1699
错层 749
复式 462
Loft 1
- 房屋属性
print('unitUsage\n', df.unitUsage.value_counts())
unitUsage
普通住宅 178530
商业办公类 3778
车库 2781
别墅 858
商业 1
写字楼 1
四合院 1
成交最多的当然是住宅。后面就重点分析住宅的情况。
2. 成交量
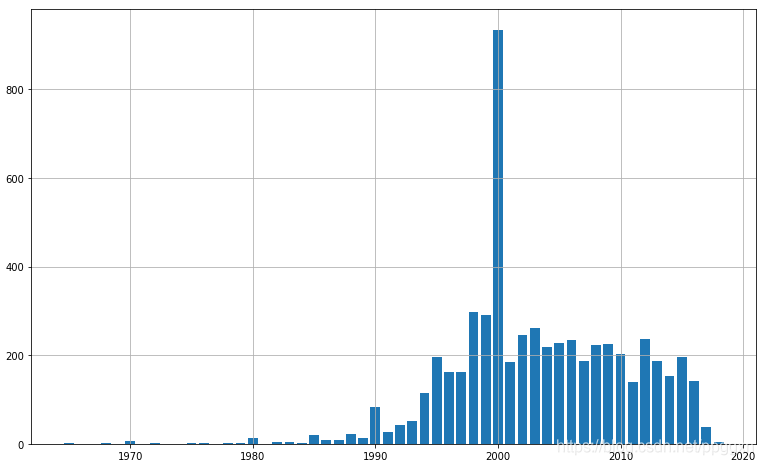
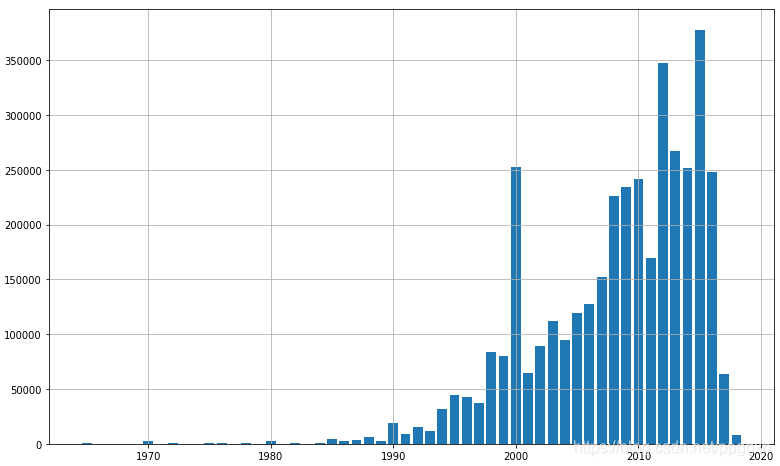
- 按房屋建成年代统计成交量
tmp = df.builtYear.value_counts().sort_index(ascending=False)
x = tmp.index.tolist()[:-1]
y = tmp.values.tolist()[:-1]
plt.figure(figsize=(13, 8), facecolor='w')
plt.bar(x,y)
plt.grid()
plt.title('Number of builtYear')
plt.show()
- 挂牌当天就成交的数量
tmp = df[df.listedDays ==1]
print('挂牌当天就成交的数量::', tmp.shape[0])
plt.figure(figsize=(13, 8), facecolor='w')
tmp.groupby('dealedTime').count()['unitType'].plot()
plt.show()
2013年的峰值是怎么回事?
tmp.groupby('dealedTime').count()['unitType'].sort_values(ascending=False)[0:19]
dealedTime
2013-03-10 166
2013-03-09 128
2013-03-03 118
2013-03-31 99
2013-03-08 97
2013-03-16 97
2013-03-04 96
2013-03-07 90
2013-03-11 87
2013-03-17 82
2013-03-06 80
2013-03-24 80
2013-02-24 78
2013-03-18 77
2013-10-31 76
2013-03-12 75
2014-02-23 74
2013-03-05 73
2013-03-15 72
2013-03-02 71
Name: unitType, dtype: int64
按成交日分组统计成交量,前20个日子有19个都在2013年3月。查了下原来2013年2月新国五条出炉,全国部分城市实行二手房 20%个税。大家就赶着卖啊!
- 住宅成交量
plt.figure(figsize=(13, 8), facecolor='w')
df[(df.unitUsage=='普通住宅')&(df.propertyYear==70)].groupby('dealedTime').count()['unitType'].plot()
plt.show()
3.成交价
- 挂牌价与成交价之差
tmp = df.listedPrice - df.totalPrice
print('挂牌价与成交价之差前十:', sum(tmp.value_counts()[0:6]),
      ',占比', sum(tmp.value_counts()[0:6])/df.shape[0])
tmp.value_counts()[0:6]
挂牌价与成交价之差前十的数量: 111971 ,占比 0.602156493681097
0.0 49885
2.0 14708
1.0 11196
3.0 10676
4.0 6618
5.0 6444
0.5 3520
1.5 3473
2.5 2883
6.0 2568
dtype: int64
结论: 大部分成交价都不高于挂牌价,降个几万块卖掉很正常。
- 房屋单价 (万/平米)
print(df.pricePerMetre.describe())
count 183109.000000
mean 10701.069303
std 4724.150763
min 203.000000
25% 7563.000000
50% 9493.000000
75% 12764.000000
max 141490.000000
最高的单价超过14万…搞错没有?
df[df.pricePerMetre >= 100000]
| agent | agentID | area | blockID | browses | buildingStructure | buildingType | builtYear | dealHouseTxt | dealedTime | decoration | district | elevator_units | feature | floor | follows | hasElevator | listedDays | listedPrice | listedTime | orientation | ownership | priceAjustment | pricePerMetre | propertyYear | title | totalPrice | transactionType | transactionYear | unitStructure | unitType | unitUsage | usableArea | visits | |
|---|---|---|---|---|---|---|---|---|---|---|---|---|---|---|---|---|---|---|---|---|---|---|---|---|---|---|---|---|---|---|---|---|---|---|
| houseID | ||||||||||||||||||||||||||||||||||
| CDGX90106318 | NaN | 0 | 47.0 | 1611041606967 | NaN | 钢混结构 | 板楼 | 2006.0 | 近地铁 | 2015-08-21 | 其他 | shenxianshu | 三梯十户 | NaN | 低楼层(共16层) | 0 | 1.0 | 1.0 | 42.0 | 2015-08-21 | 南 北 | NaN | 0 | 141490 | 70.0 | 和贵时代巢 | 665.0 | 商品房 | NaN | NaN | 1室0厅1厨1卫 | 普通住宅 | NaN | 0 |
看看这个小区的成交价
df[df.blockID == 1611041606967].pricePerMetre.describe()
count 137.000000
mean 12181.613139
std 11531.907341
min 7765.000000
25% 9333.000000
50% 10220.000000
75% 12103.000000
max 141490.000000
看来是小数点位置错了。改正一下吧
df.loc['CDGX90106318','pricePerMetre'] = df.loc['CDGX90106318','pricePerMetre'] / 10
单价5万以上的还有些数据有误,这里就不详细列出来了。
极大值修正了,下面看看极小值。
这里只保留住宅,并且把总价10万以内的去掉。
# 只保留住宅
df = df[(df.unitUsage=='普通住宅')&(df.propertyYear==70)]
# 把总价10万以内的去掉
df = df[df.totalPrice > 10]
print(df[(df.totalPrice <= 20) & (df.listedTime==df.dealedTime)].shape[0])
print(df[df.totalPrice <= 20].shape[0])
print(df[(df.totalPrice <= 30) & (df.listedTime==df.dealedTime)].shape[0])
print(df[df.totalPrice <= 30].shape[0])
print('**')
print(sum(pd.isna(df[(df.totalPrice <= 20) & (df.listedTime==df.dealedTime)].feature)))
print(sum(pd.isna(df[df.totalPrice <= 20].feature)))
print(sum(pd.isna(df[(df.totalPrice <= 30) & (df.listedTime==df.dealedTime)].feature)))
print(sum(pd.isna(df[df.totalPrice <= 30].feature)))
102
340
799
2596
**
102
256
799
2008
去掉总价30万以内且没有feature的数据
df = df[((df.totalPrice <=30) & pd.isna(df.feature))==False]
df.shape[0]
175131
- 住宅成交均价走势图
df_house = df
tmp = df_house.groupby('dealedTime')
# 均价走势
meanPrice = pd.DataFrame((tmp.sum()['totalPrice'])/(tmp.sum()['area']))
x1 = meanPrice.index.tolist()
y1 = meanPrice.values.tolist()
# 2018年以来的均价走势
tmp = df_house[df_house.dealedTime > '2018'].groupby('dealedTime')
meanPrice = pd.DataFrame((tmp.sum()['totalPrice'])/(tmp.sum()['area']))
x2 = meanPrice.index.tolist()
y2 = meanPrice.values.tolist()
plt.figure(figsize=(20, 8), facecolor='w')
ax1 = plt.subplot(121)
ax1.plot(x1, y1)
plt.grid(True)
ax2 = plt.subplot(122)
ax2.plot(x2, y2)
plt.grid(True)
plt.suptitle(u'MeanPrice', fontsize=20)
plt.show()
- 按小区计算成交均价
# 计算各个小区的季度成交均价
seasonStart, seasonEnd, seasonData = [],[],[]
table = pd.DataFrame()
dateStart = ['0101','0401','0701','1001']
dateEnd = ['0331','0630','0930','1231']
for i in range(9):
    for j in range(4):
        seasonStart.append('201' + str(i) + dateStart[j])
        seasonEnd.append('201' + str(i) + dateEnd[j])

for blockID in df_house.blockID.drop_duplicates():
    price_season = []
    df = df_house[df_house.blockID == blockID]
    for i in range(36):
        price = df[(df.dealedTime <= seasonEnd[i]) & (df.dealedTime >= seasonStart[i])]
        # 如果成交量不为0:
        areaSum = price.area.sum()
        if areaSum:
            price_season.append(price.totalPrice.sum() / areaSum)
        else:
            price_season.append(0)
#         num_season.append(price.shape[0])
    row = pd.DataFrame(price_season, columns=[blockID]).transpose()
    table = table.append(row)
table.columns = seasonEnd
table.head(3)
| 20100331 | 20100630 | 20100930 | 20101231 | 20110331 | 20110630 | 20110930 | 20111231 | 20120331 | 20120630 | 20120930 | 20121231 | 20130331 | 20130630 | 20130930 | 20131231 | 20140331 | 20140630 | 20140930 | 20141231 | 20150331 | 20150630 | 20150930 | 20151231 | 20160331 | 20160630 | 20160930 | 20161231 | 20170331 | 20170630 | 20170930 | 20171231 | 20180331 | 20180630 | 20180930 | 20181231 | |
|---|---|---|---|---|---|---|---|---|---|---|---|---|---|---|---|---|---|---|---|---|---|---|---|---|---|---|---|---|---|---|---|---|---|---|---|---|
| 1611041736706 | 0.837209 | 0.000000 | 0.0 | 0.0 | 0.0 | 0.0 | 0.0 | 0.0 | 0.0 | 1.013776 | 1.060018 | 1.087637 | 1.096615 | 1.242458 | 1.122991 | 1.174408 | 1.110373 | 1.112799 | 1.007769 | 1.124149 | 1.094431 | 1.145196 | 1.231889 | 1.245007 | 1.188826 | 1.250666 | 1.282542 | 1.357817 | 1.595426 | 1.800378 | 2.012120 | 2.379557 | 2.567605 | 2.583029 | 2.186766 | 2.256848 |
| 3011053812925 | 0.000000 | 0.946835 | 0.0 | 0.0 | 0.0 | 0.0 | 0.0 | 0.0 | 0.0 | 1.277778 | 1.333679 | 1.247095 | 1.265897 | 1.280712 | 1.434426 | 1.281119 | 1.235797 | 1.043956 | 1.131868 | 1.109630 | 0.000000 | 1.208551 | 1.011583 | 1.283109 | 1.307769 | 1.521298 | 1.536435 | 1.764860 | 1.630417 | 1.934985 | 2.408024 | 2.631629 | 0.000000 | 2.475933 | 2.395604 | 2.449109 |
| 3011053393070 | 0.000000 | 0.548154 | 0.0 | 0.0 | 0.0 | 0.0 | 0.0 | 0.0 | 0.0 | 0.666474 | 0.000000 | 0.000000 | 0.732205 | 0.000000 | 0.670918 | 0.739535 | 0.719043 | 0.727057 | 0.000000 | 0.000000 | 0.000000 | 0.000000 | 0.000000 | 0.673407 | 0.713615 | 0.699070 | 0.849391 | 0.751822 | 0.804164 | 0.896106 | 1.093842 | 1.414834 | 1.491133 | 1.532258 | 0.000000 | 1.140351 |
# 计算季度价格环比涨幅
pre, cur = None,None
for col in table.columns:
    if col=='20100331':
        pre = table[col].values.copy()
        continue
    cur = table[col].values.copy()
    table[col] = cur / pre
    pre = cur
table.head(3)
| 20100331 | 20100630 | 20100930 | 20101231 | 20110331 | 20110630 | 20110930 | 20111231 | 20120331 | 20120630 | 20120930 | 20121231 | 20130331 | 20130630 | 20130930 | 20131231 | 20140331 | 20140630 | 20140930 | 20141231 | 20150331 | 20150630 | 20150930 | 20151231 | 20160331 | 20160630 | 20160930 | 20161231 | 20170331 | 20170630 | 20170930 | 20171231 | 20180331 | 20180630 | 20180930 | 20181231 | |
|---|---|---|---|---|---|---|---|---|---|---|---|---|---|---|---|---|---|---|---|---|---|---|---|---|---|---|---|---|---|---|---|---|---|---|---|---|
| 1611041736706 | 0.837209 | 0.000000 | NaN | NaN | NaN | NaN | NaN | NaN | NaN | inf | 1.045614 | 1.026055 | 1.008255 | 1.132995 | 0.903846 | 1.045785 | 0.945475 | 1.002185 | 0.905616 | 1.115482 | 0.973564 | 1.046385 | 1.075701 | 1.010649 | 0.954875 | 1.052017 | 1.025487 | 1.058692 | 1.174993 | 1.128462 | 1.117610 | 1.182612 | 1.079027 | 1.006007 | 0.846590 | 1.070834 |
| 3011053812925 | 0.000000 | inf | 0.0 | NaN | NaN | NaN | NaN | NaN | NaN | inf | 1.043748 | 0.935079 | 1.015077 | 1.011703 | 1.120022 | 0.893123 | 0.964623 | 0.844763 | 1.084211 | 0.980352 | 0.000000 | inf | 0.837021 | 1.268417 | 1.019218 | 1.163278 | 1.009950 | 1.148672 | 0.923822 | 1.186803 | 1.244467 | 1.092858 | 0.000000 | inf | 0.967556 | 0.000000 |
| 3011053393070 | 0.000000 | inf | 0.0 | NaN | NaN | NaN | NaN | NaN | NaN | inf | 0.000000 | NaN | inf | 0.000000 | inf | 1.102274 | 0.972291 | 1.011144 | 0.000000 | NaN | NaN | NaN | NaN | inf | 1.059708 | 0.979618 | 1.215031 | 0.885130 | 1.069620 | 1.114333 | 1.220661 | 1.293454 | 1.053928 | 1.027580 | 0.000000 | NaN |
# 将 inf 和 0 替换为 nan
table = table.applymap(lambda x: np.nan if x == np.inf else x)
table = table.applymap(lambda x: x if x > 0 else np.nan)

for i in table.columns:
    print(sum(table[i]>0), end=',')

# 因前8列有成交的小区数量过少,故舍弃不用
table.drop(axis=1, columns=['20100331','20100630','20100930','20101231','20110331',
                            '20110630','20110930','20111231'], inplace=True)
table.to_csv('seasonTable.csv')
table.head(3)
1,2,6,11,20,19,20,34,249,870,710,896,1235,1001,1095,1068,1030,960,902,939,910,1408,1704,1995,2319,2610,2707,2668,3024,2409,3173,3277,2857,2431,2317,2465,
| 20120331 | 20120630 | 20120930 | 20121231 | 20130331 | 20130630 | 20130930 | 20131231 | 20140331 | 20140630 | 20140930 | 20141231 | 20150331 | 20150630 | 20150930 | 20151231 | 20160331 | 20160630 | 20160930 | 20161231 | 20170331 | 20170630 | 20170930 | 20171231 | 20180331 | 20180630 | 20180930 | 20181231 | |
|---|---|---|---|---|---|---|---|---|---|---|---|---|---|---|---|---|---|---|---|---|---|---|---|---|---|---|---|---|
| 1611041736706 | NaN | 1.013776 | 1.060018 | 1.087637 | 1.096615 | 1.242458 | 1.122991 | 1.174408 | 1.110373 | 1.112799 | 1.007769 | 1.124149 | 1.094431 | 1.145196 | 1.231889 | 1.245007 | 1.188826 | 1.250666 | 1.282542 | 1.357817 | 1.595426 | 1.800378 | 2.012120 | 2.379557 | 2.567605 | 2.583029 | 2.186766 | 2.256848 |
| 3011053812925 | NaN | 1.277778 | 1.333679 | 1.247095 | 1.265897 | 1.280712 | 1.434426 | 1.281119 | 1.235797 | 1.043956 | 1.131868 | 1.109630 | NaN | 1.208551 | 1.011583 | 1.283109 | 1.307769 | 1.521298 | 1.536435 | 1.764860 | 1.630417 | 1.934985 | 2.408024 | 2.631629 | NaN | 2.475933 | 2.395604 | 2.449109 |
| 3011053393070 | NaN | 0.666474 | NaN | NaN | 0.732205 | NaN | 0.670918 | 0.739535 | 0.719043 | 0.727057 | NaN | NaN | NaN | NaN | NaN | 0.673407 | 0.713615 | 0.699070 | 0.849391 | 0.751822 | 0.804164 | 0.896106 | 1.093842 | 1.414834 | 1.491133 | 1.532258 | NaN | 1.140351 |
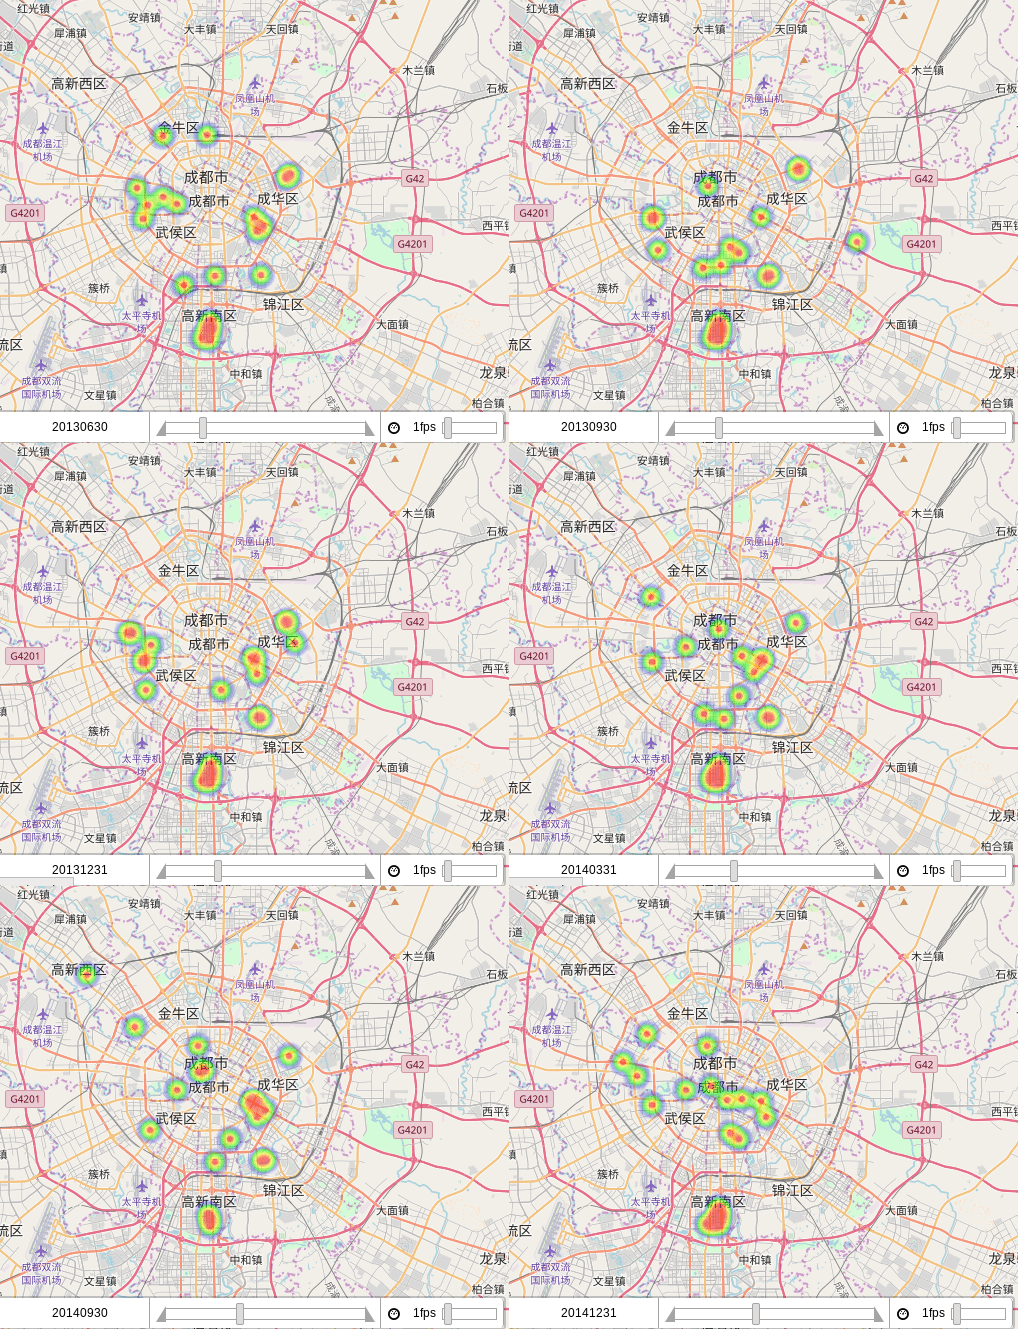
最后得到的这张表格是各个小区的季度均价环比涨幅。下面画个动态热力图看看哪儿的小区房价窜得快
下面是小区历史累积成交量静态热力图:
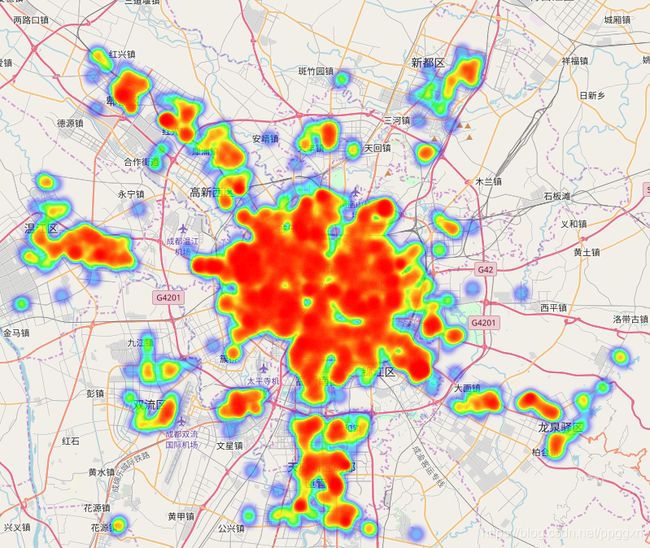
很明显,成交集中在三环内和地铁沿线。
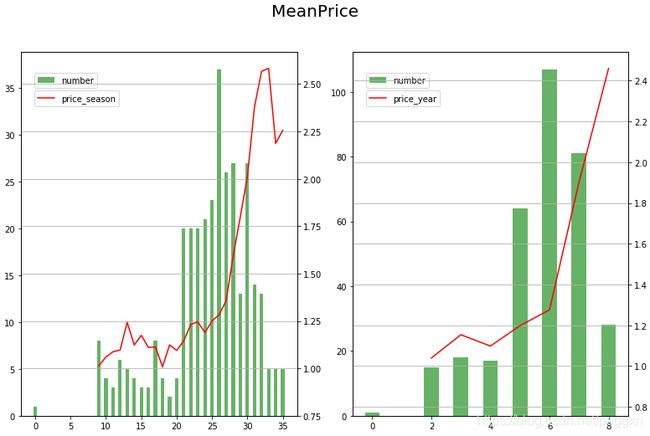
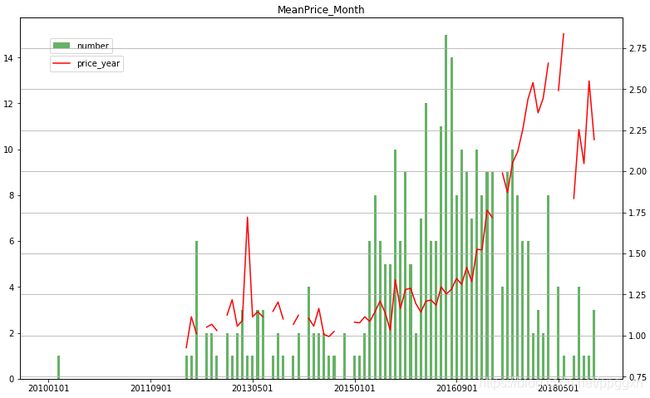
- 按小区绘制价格与数量。
def plotPrice(df):
    price_year, price_season, price_month, num_year, num_season, num_month, yearStart, yearEnd, seasonStart, seasonEnd = [],[],[],[],[],[],[],[],[],[]
    dateStart = ['0101','0401','0701','1001']
    dateEnd = ['0331','0630','0930','1231']
    dateMonth = []
    for i in range(9):
        yearStart.append('201' + str(i) + '0101')
        yearEnd.append('201' + str(i) + '1231')
    for i in range(9):
        for j in range(4):
            seasonStart.append('201' + str(i) + dateStart[j])
            seasonEnd.append('201' + str(i) + dateEnd[j])
    for i in range(9):
        for j in range(1,13):
            if j < 10:
                dateMonth.append('201' + str(i) + '0' + str(j) + '01')
            else:
                dateMonth.append('201' + str(i) + str(j) + '01')
    dateMonth.append('20190101')
    for i in range(9):
        price = df[(df.dealedTime <= yearEnd[i]) & (df.dealedTime >= yearStart[i])]
        price_year.append(price.totalPrice.sum() / price.area.sum())
        num_year.append(price.shape[0])
    for i in range(36):
        price = df[(df.dealedTime <= seasonEnd[i]) & (df.dealedTime >= seasonStart[i])]
        price_season.append(price.totalPrice.sum() / price.area.sum())
        num_season.append(price.shape[0])
    for i in range(len(dateMonth)):
        price = df[(df.dealedTime < dateMonth[i+1]) & (df.dealedTime >= dateMonth[i])]
        price_month.append(price.totalPrice.sum() / price.area.sum())
        num_month.append(price.shape[0])
        if i == len(dateMonth)-2:
            break

    plt.figure(figsize=(13, 8), facecolor='w')
    ax = plt.subplot(121) #做一个 1 行 2 列的图,当前为图 1
    ax.bar(np.arange(36), num_season, color='g', width=0.5, alpha=0.6, label='number')
    plt.legend(loc=(0.05,0.9))
    ax1 = ax.twinx()
#     ax1.plot(num_season, color='r', label='number')
    ax1.plot(price_season, color='r', linewidth=1.5, label='price_season')
    plt.legend(loc=(0.05,0.85))
    plt.grid(True)
    ax = plt.subplot(122)
    ax.bar(np.arange(9), num_year, color='g', width=0.5, alpha=0.6, label='number')
    plt.legend(loc=(0.05,0.9))
    ax1 = ax.twinx()
    ax1.plot(price_year, color='r', linewidth=1.5, label='price_year')
    plt.xlabel('year', fontsize=15)
    plt.legend(loc=(0.05,0.85))
    plt.grid()
    plt.suptitle(u'MeanPrice', fontsize=20)
    plt.show()
    plt.figure(figsize=(13, 8), facecolor='w')
    plt.bar(np.arange(len(dateMonth)-1), num_month, color='g', width=0.5, alpha=0.6, label='number')
    plt.legend(loc=(0.05,0.9))
    plt.twinx()
    plt.plot(price_month, color='r', linewidth=1.5, label='price_year')
    plt.legend(loc=(0.05,0.85))
    plt.grid(True)
    plt.xticks([i*20 for i in range(6)], [dateMonth[i*20] for i in range(6)])
    plt.title('MeanPrice_Month')
    plt.show()
    return sum(num_year), df.totalPrice.sum() / df.area.sum()
4.小区分析
print('小区数量: ', blockDetail_df.shape[0])
print('物管公司数量: ', blockDetail_df.PMC.drop_duplicates().shape[0])
print('开发商数量: ', blockDetail_df.developer.drop_duplicates().shape[0])
print('物管前15名(根据管理小区数量排序): \n', blockDetail_df.PMC.value_counts().head(15))
print('开发商前15名(根据开发小区数量排序): \n', blockDetail_df.developer.value_counts().head(10))
小区数量: 7222
物管公司数量: 855
开发商数量: 1223
**
物管前15名(根据管理小区数量排序):
私人承办物业 1539
暂无信息 1532
业主自筹物业 965
街道办事处(居委会)代管物业 569
小区物管处 229
成都金房物业服务有限公司 39
成都中海物业管理有限公司 34
成都交大智能物业管理有限公司 26
成都仁和春天物业管理有限公司 26
蓝光嘉宝物业管理有限公司 23
成都合力物业服务有限公司 21
无物业管理服务 20
成都麓山物业管理有限公司 19
成都心连心物业管理有限公司 18
成都龙湖物业服务有限公司 16
**
开发商前15名(根据开发小区数量排序):
无开发商 2798
暂无信息 1749
中房集团成都房地产开发总公司 40
中铁二局房地产集团有限公司 35
成都金房集团有限公司 28
中房集团成都房地产开发有限公司 22
成都交大房产开发有限责任公司 22
成都万华房地产开发有限公司 20
成都人居置业有限公司 19
成都置信实业(集团)有限公司 17
blockDetail_df.sort_values(by=['unitsNum', 'buildingsNum'], ascending=False, inplace=True)
print('所有小区户数总计: ', sum(blockDetail_df.unitsNum))
blockDetail_df.head(3)
所有小区户数总计: 4165323
| PMC | address | buildingTypes | buildingsNum | builtYear | coordinate | developer | fee | title | unitsNum | |
|---|---|---|---|---|---|---|---|---|---|---|
| blockID | ||||||||||
| 1611061524964 | 重庆新龙湖物业有限公司 | (高新西高新西)合作路89号 | 塔楼/板楼/塔板结合 | 25 | 2011 | 103.928587,30.76087 | 成都龙湖锦鸿置业有限公司 | 2.8至11元/平米/月 | 龙湖时代天街 | 13550 |
| 1611063168544 | 成都宏鹏物业管理有限公司 | (郫都郫县万达)望丛东路139号 | 塔楼/板楼/塔板结合 | 24 | 2010 | 103.913345,30.813595 | 成都市郫县万达广场投资有限公司 | 2至4.5元/平米/月 | 蜀都万达广场 | 10673 |
| 3011056075583 | 成都森宇物业管理有限公司 | (天府新区南湖)南湖西路175号 | 板楼/塔板结合 | 41 | 2010 | 104.047914,30.502704 | 成都森宇实业集团有限公司 | 1.5元/平米/月 | 南湖国际社区 | 9799 |
小区户数中位数: 247
小区户数平均数: 575
按户数对物管公司排序:
蓝光嘉宝物业管理有限公司 36625
成都合能物业管理有限公司 34558
成都中海物业管理有限公司 32214
成都万科物业管理有限公司 28425
成都龙湖物业服务有限公司 27148
成都森宇物业管理有限公司 25896
成都金房物业服务有限公司 25729
华润置地(成都)物业服务有限公司 25546
成都仁和春天物业管理有限公司 22843
保利物业管理有限公司成都分公司 22601
按户数对开发商排序:
华润置地(成都)发展有限公司 28059
成都龙湖地产有限公司 27037
成都森宇实业集团有限公司 24337
中房集团成都房地产开发总公司 24053
保利(成都)房地产开发有限公司 20769
成都人居置业有限公司 19729
四川蓝光实业集团有限公司 18371
成都城投地产有限公司 18215
成都金房集团有限公司 18209
四川蓝光和骏实业股份有限公司 18022
和记黄埔地产(成都)有限公司 16665
中房集团成都房地产开发有限公司 16398
成都双流和骏置业有限公司 15858
- 小区的换手率
| PMC | address | buildingTypes | buildingsNum | builtYear | coordinate | developer | fee | title | unitsNum | dealedNum | ratio | |
|---|---|---|---|---|---|---|---|---|---|---|---|---|
| 3011055361769 | 重庆泓山物业管理有限公司成都分公司 | (郫都成外)金粮路566号 | 塔楼/板楼/塔板结合 | 36 | 2007 | 103.996741,30.733224 | 上海绿地集团成都公司 | 1.5元/平米/月 | 派克公馆 | 5441 | 1184 | 0.217607 |
| 3011056095764 | 街道办事处(居委会)代管物业 | (高新西高新西)尚锦路116号 | 塔板结合 | 38 | 2008 | 103.933645,30.783262 | 成都市武侯区桂溪房地产开发公司 | 1.2元/平米/月 | 上锦颐园 | 3601 | 937 | 0.260205 |
| 3011056075583 | 成都森宇物业管理有限公司 | (天府新区南湖)南湖西路175号 | 板楼/塔板结合 | 41 | 2010 | 104.047914,30.502704 | 成都森宇实业集团有限公司 | 1.5元/平米/月 | 南湖国际社区 | 9799 | 872 | 0.088989 |
按成交量排序,派克公馆夺得第一名。小区总共5千多套,交易过1千多套…
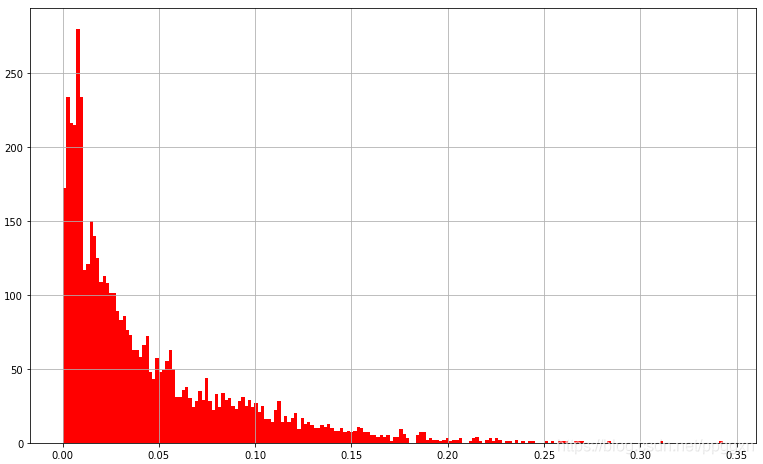
换手率 >20% 小区数: 46
换手率中位数: 2.7%
换手率平均数: 4.4%


