kaggle常见操作及错误
kaggle常见操作及错误
- 常用操作
- 读取文件时,查看当前文件夹:
- 使用sklearn机器学习库
- 绘制混淆矩阵
- 几个坑
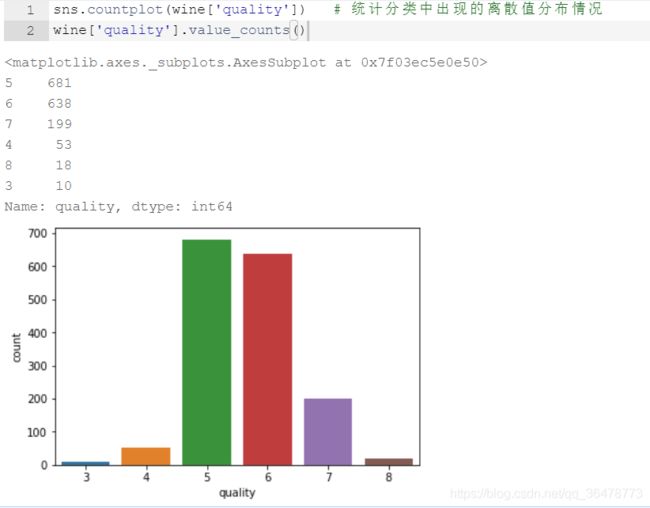
- 对于分类问题,查看离散数值分布情况
- 封装常见API接口
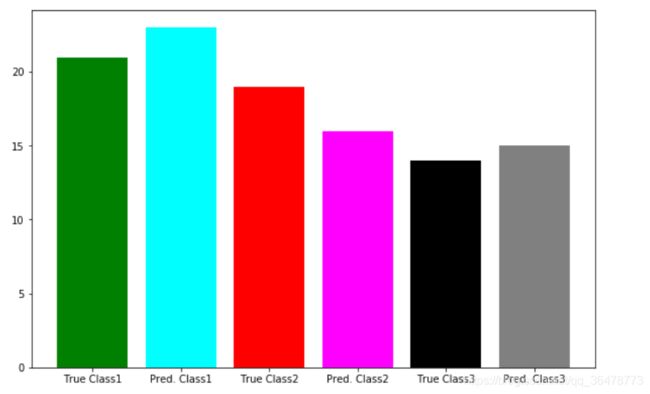
- 分类效果展示
- 直方图展示
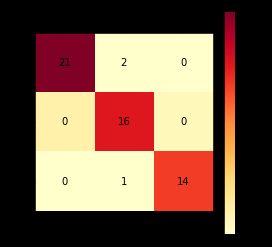
- 混淆矩阵
- 常见错误
- name '__file__' is not defined
常用操作
读取文件时,查看当前文件夹:
from subprocess import check_output
print(check_output(["ls", "../input"]).decode("utf8"))
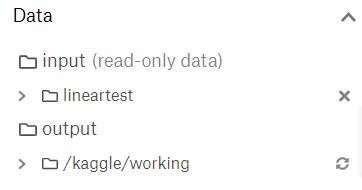
上传到kaggle的文件直接位于input文件夹下(不用管input显示的下层文件夹)
注意,魔术行和命令直接不要有空格 % ls错误。
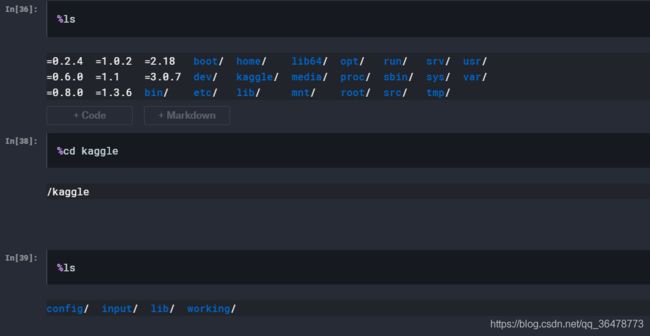
kaggle一开始,默认处于kaggle/working

因而直接使用xArr, yArr = loadDataSet('../input/ex0.txt') 读取文件即可。
使用sklearn机器学习库
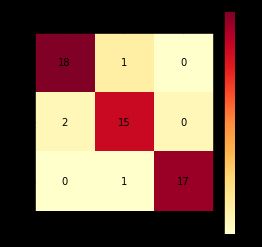
绘制混淆矩阵
import matplotlib.pyplot as plt
from sklearn.metrics import confusion_matrix
import numpy as np

def cm_plot(original_label, predict_label, pic=None):
    cm = confusion_matrix(original_label, predict_label)   # 直接生成n*n混淆矩阵
    plt.figure()
    plt.matshow(cm, cmap=plt.cm.YlOrRd)     # 画混淆矩阵,配色风格使用cm.Blues
    plt.colorbar()    # 添加颜色渐变标签
    for x in range(len(cm)):
        for y in range(len(cm)):
            plt.annotate(cm[x, y], xy=(x, y), horizontalalignment='center', verticalalignment='center')
            # annotate主要在图形中添加注释
            # 第一个参数添加注释
            # 第二个参数是注释的内容
            # xy设置箭头尖的坐标
            # horizontalalignment水平对齐
            # verticalalignment垂直对齐
            # 其余常用参数如下:
            # xytext设置注释内容显示的起始位置
            # arrowprops 用来设置箭头
            # facecolor 设置箭头的颜色
            # headlength 箭头的头的长度
            # headwidth 箭头的宽度
            # width 箭身的宽度
    plt.ylabel('True label')  # 坐标轴标签
    plt.xlabel('Predicted label')  # 坐标轴标签
    plt.title('confusion matrix')
    if pic is not None:
        plt.savefig(str(pic) + '.jpg')
    plt.show()

cm_plot(testY,prediction)
几个坑
-
首先,对于在sklearn中选择的model,可以和keras一样使用model.fit进行训练,但是此处的fit必须是单维度的,否则会报错。例如对于离散数值分类,进行one-hot编码后会报错。
但在keras中使用softmax是没有问题的。
(此问题后续再回头了解下) -
另外,对于model.fit传入的参数类型,
numpy.array和pd.DataFrame都可以。 -
对于shape结果为
(54,)表示[数组内有54个元素],类似于[1,2,3,…,54]
对于分类问题,查看离散数值分布情况
import seaborn as sns
sns.countplot(Y)   # 统计分类中出现的离散值分布情况
Y.value_counts()
封装常见API接口
分类效果展示
直方图展示
def plot_result(testY,prediction):
    x = np.arange(6)
    y = [sum(np.array(testY)==1), sum(prediction==1),
         sum(np.array(testY)==2), sum(prediction==2),
         sum(np.array(testY)==3), sum(prediction==3)]
    colors = ("green", "cyan", "red", "magenta", "black", "gray")
    plt.figure(figsize=(15, 6.5))
    plt.bar(x, y, color=colors)
    plt.xticks(x, ("True Class1", "Pred. Class1", "True Class2", "Pred. Class2",
        "True Class3", "Pred. Class3"))
#     if add_title:
#         plt.title('k = %d' % model.get_params()['n_neighbors'])
    plt.show()
混淆矩阵
def cm_plot(original_label, predict_label, pic=None):
    cm = confusion_matrix(original_label, predict_label)   # 直接生成n*n混淆矩阵
    plt.figure(figsize=(20, 6.5))
    plt.matshow(cm, cmap=plt.cm.YlOrRd)     # 画混淆矩阵,配色风格使用cm.Blues
    plt.colorbar()    # 添加颜色渐变标签
    for x in range(len(cm)):
        for y in range(len(cm)):
            plt.annotate(cm[x, y], xy=(x, y), horizontalalignment='center', verticalalignment='center')
            # annotate主要在图形中添加注释
            # 第一个参数添加注释
            # 第二个参数是注释的内容
            # xy设置箭头尖的坐标
            # horizontalalignment水平对齐
            # verticalalignment垂直对齐
            # 其余常用参数如下:
            # xytext设置注释内容显示的起始位置
            # arrowprops 用来设置箭头
            # facecolor 设置箭头的颜色
            # headlength 箭头的头的长度
            # headwidth 箭头的宽度
            # width 箭身的宽度
    plt.ylabel('True label')  # 坐标轴标签
    plt.xlabel('Predicted label')  # 坐标轴标签
    plt.title('confusion matrix')
    if pic is not None:
        plt.savefig(str(pic) + '.jpg')
    plt.show()
常见错误
name ‘file’ is not defined
import os
curr_path = os.path.dirname(os.path.realpath(__file__))    # 当前路径

