机器学习算法与Python实践(6) - 学习矢量量化(LVQ)
学习矢量量化(LVQ)
学习矢量量化,又称学习向量量化,属于聚类算法。
LVQ网络是一种有监督学习的自组织竞争网络,他与SOM的主要区别在于LVQ是“有监督”的。具体描述的话,可以总结为两点:
- 所有输入的数据,需要给出其种类标签label。
- 找到距离当前输入节点(i)最近的输出层节点(o)之后,som直接调节o的特征使之趋近于i,而lvq则首先比较i与o的种类标签label是否是相同的,如果相同,则代表二者属于相同的种类,并调节o的特征使之趋近于i;反之,则调节o的特征使之远离于i。
学习向量量化算法和K均值算法类似,是找到一组原型向量来聚类, 每一个原型向量代表一个簇,将空间划分为若干个簇,从而对于任意的样本,可以将它划入到与它距离最近的簇中。特别的是LVQ假设数据样本带有类别标记,可以用这些类别标记来辅助聚类。
LVQ是由数据驱动的,数据搜索距离它最近的两个神经元,对于同类神经元采取拉拢,异类神经元采取排斥,这样相对于只拉拢不排斥能加快算法收敛的速度,最终得到数据的分布模式,开头提到,如果我得到已知标签的数据,我要求输入模式,我直接求均值就可以,用LVQ或者SOM的好处就是对于离群点并不敏感,少数的离群点并不影响最终结果,因为他们对最终的神经元分布影响很小。
核心思想:
- 统计样本的类别,假设一共有 q 类,初始化为原型向量的标记为{ t1,t2,……,tq }。从样本中随机选取 q 个样本点位原型向量{ p1,p2,……,pq }。初始化一个学习率 a , a 取值范围(0,1)。
- 从样本集中随机选取一个样本 (x,y) ,计算该样本与 q 个原型向量的距离(欧几里得距离),找到最小的那个原型向量 p ,判断样本的标记 y 与原型向量的标记 t 是不是一致。若一致则更新为 p′=p+a∗(x−p) ,否则更新为 p′=p−a∗(x−p) 。
- 重复第2步直到满足停止条件。(如:达到最大迭代次数)
- 返回 q 个原型向量。
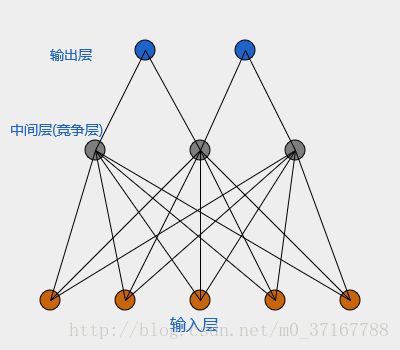
这里给出LVQ的层级结构示意:
代码如下:
# -*- coding:utf-8 -*-
import re
import math
import numpy as np
import pylab as pl

data = \
    """1,0.697,0.46,Y,
    2,0.774,0.376,Y,
    3,0.634,0.264,Y,
    4,0.608,0.318,Y,
    5,0.556,0.215,Y,
    6,0.403,0.237,Y,
    7,0.481,0.149,Y,
    8,0.437,0.211,Y,
    9,0.666,0.091,N,
    10,0.639,0.161,N,
    11,0.657,0.198,N,
    12,0.593,0.042,N,
    13,0.719,0.103,N"""


# 定义一个西瓜类,四个属性,分别是编号,密度,含糖率,是否好瓜
class watermelon:
    def __init__(self, properties):
        self.number = properties[0]
        self.density = float(properties[1])
        self.sweet = float(properties[2])
        self.good = properties[3]


# 数据简单处理
a = re.split(',', data.strip(" "))
dataset = []  # dataset:数据集
for i in range(int(len(a) / 4)):
    temp = tuple(a[i * 4: i * 4 + 4])
    dataset.append(watermelon(temp))


# 计算欧几里得距离,a,b分别为两个元组
def dist(a, b):
    return math.sqrt(math.pow(a[0] - b[0], 2) + math.pow(a[1] - b[1], 2))


# 算法模型
def LVQ(dataset, a, max_iter):
    # 统计样本一共有多少个分类
    T = list(set(i.good for i in dataset))
    # 随机产生原型向量
    P = [(i.density, i.sweet) for i in np.random.choice(dataset, len(T))]
    while max_iter > 0:
        X = np.random.choice(dataset, 1)[0]
        index = np.argmin(dist((X.density, X.sweet), i) for i in P)
        t = T[index]
        if t == X.good:
            P[index] = ((1 - a) * P[index][0] + a * X.density, (1 - a) * P[index][1] + a * X.sweet)
        else:
            P[index] = ((1 + a) * P[index][0] - a * X.density, (1 + a) * P[index][1] - a * X.sweet)
        max_iter -= 1
    return P


def train_show(dataset, P):
    C = [[] for i in P]
    for i in dataset:
        C[i.good == 'Y'].append(i)
    return C


# 画图
def draw(C, P):
    colValue = ['r', 'y', 'g', 'b', 'c', 'k', 'm']
    for i in range(len(C)):
        coo_X = []  # x坐标列表
        coo_Y = []  # y坐标列表
        for j in range(len(C[i])):
            coo_X.append(C[i][j].density)
            coo_Y.append(C[i][j].sweet)
        pl.scatter(coo_X, coo_Y, marker='x', color=colValue[i % len(colValue)], label=i)
    # 展示原型向量
    P_x = []
    P_y = []
    for i in range(len(P)):
        P_x.append(P[i][0])
        P_y.append(P[i][1])
        pl.scatter(P[i][0], P[i][1], marker='o', color=colValue[i % len(colValue)], label="vector")
    pl.legend(loc='upper right')
    pl.show()


if __name__ == '__main__':
    P = LVQ(dataset, 0.01, 60)
    C = train_show(dataset, P)
    draw(C, P)
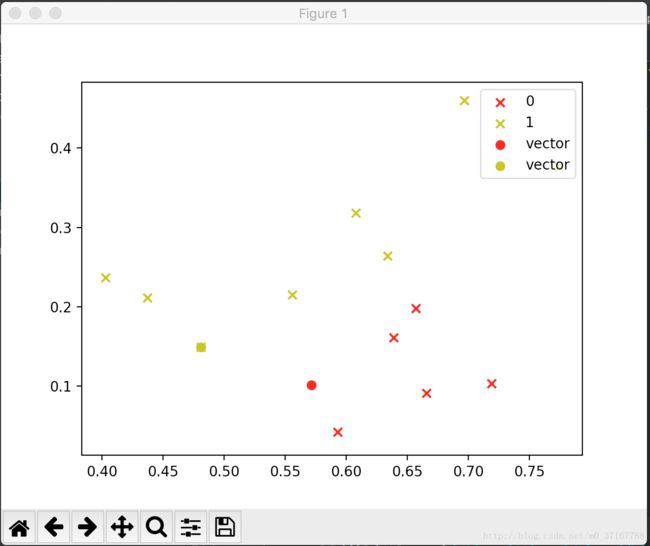
结果展示:

