线性回归
1.1监督学习&无监督学习
1.1.1监督学习Supervised learning
- 定义:从标注数据中学习预测模型的机器学习问题。
- 标注数据:表示输入输出的对应关系,预测模型对给定的输入产生对应的输出。
- 本质:监督学习的本质是学习输入输出的映射的统计规律。
1.1.2无监督学习Unsupervised learning
- 定义:从无标注数据中学习预测模型的机器学习问题。
- 无标注数据:是自然得到的数据,预测模型表示数据的类别、转换或概率。
- 本质:无监督学习的本质是学习数据中的统计规律或潜在结构。
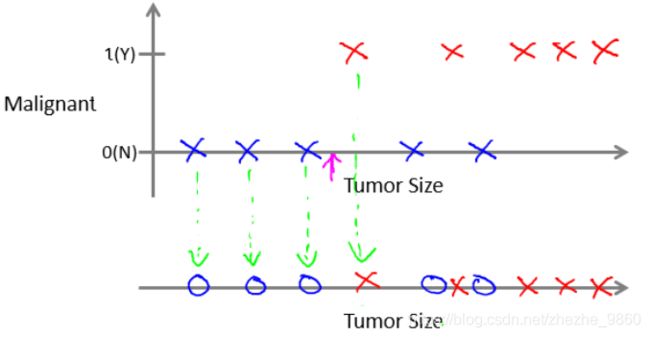
- 无监督学习的例子:
- Google新闻(聚类)
1.2 单变量线性回归 Liner Regression with One Variable
- 导入模块包:
import numpy as np
import pandas as pd
import matplotlib.pyplot as plt
- 读取数据:
path = 'ex1data1.txt'
data = pd.read_csv(path, header = None, names = ['Population','Profit'])
data.head()
- 看一下数据:

- pd.read_csv()函数:
- path: 文件路径
- header: 指定第几行作为列名(忽略注解行),如果没有指定列名,默认header=0; 如果指定了列名header=None
- names:指定列名,如果文件中不包含header的行,应该显性表示header=None
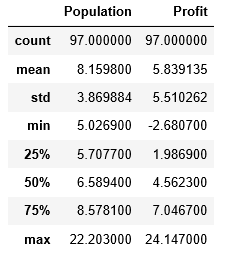
- 查看数据的统计数据:
data.describe()
- 绘制数据散点图:
data.plot(kind = 'scatter',x='Population',y='Profit',figsize=(4,3)) #散点图
plt.plot()
- 代价函数:均方误差函数
J ( θ ) = 1 2 m ∑ i = 1 m ( h θ ( x ( i ) ) − y ( i ) ) 2 J\left( \theta \right)=\frac{1}{2m}\sum\limits_{i=1}^{m}{{{\left( {{h}_{\theta }}\left( {{x}^{(i)}} \right)-{{y}^{(i)}} \right)}^{2}}} J(θ)=2m1i=1∑m(hθ(x(i))−y(i))2
其中:
h θ ( x ) = θ T X = θ 0 x 0 + θ 1 x 1 + θ 2 x 2 + . . . + θ n x n {{h}_{\theta }}\left( x \right)={{\theta }^{T}}X={{\theta }_{0}}{{x}_{0}}+{{\theta }_{1}}{{x}_{1}}+{{\theta }_{2}}{{x}_{2}}+...+{{\theta }_{n}}{{x}_{n}} hθ(x)=θTX=θ0x0+θ1x1+θ2x2+...+θnxn
def computeCost(X, y, theta):
    inner = np.power(((X * theta.T) - y), 2)
    return np.sum(inner)/(2 * len(X))
- 备注:为什么是 X ∗ t h e t a . T X * theta.T X∗theta.T?
在这个程序中,X与T可能都是行向量,这个时候就要用X * theta.T,这样才会得到一个值而不是一个矩阵。而上述公式,是在X、theta都是列向量的情况下的结果。 - 在训练集中添加一列,以便可以使用向量化的解决方案来计算代价和梯度:
data.insert(0, 'Ones', 1)
- 变量初始化:
cols = data.shape[1]
X = data.iloc[:,0:cols-1]
y = data.iloc[:,cols-1:cols]
- 计算代价函数:
- 代价函数应该是numpy矩阵,所有需要转换X,y.然后才能使用它们还要初始化theta
- theta初始值为0
X = np.matrix(X.values)
y = np.matrix(y.values)
theta = np.matrix(np.array([0,0]))
computeCost(X,y,theta)
- 梯度下降算法:
θ j : = θ j − α ∂ ∂ θ j J ( θ ) {{\theta }_{j}}:={{\theta }_{j}}-\alpha \frac{\partial }{\partial {{\theta }_{j}}}J\left( \theta \right) θj:=θj−α∂θj∂J(θ)
θ j = θ j − α 1 m ∑ 1 m ( h ( x i ) − y i ) 2 x j i \theta_{j}=\theta_{j}-\alpha \frac{1}{m} \sum_{1}^{m}\left(h\left(x^{i}\right)-y^{i}\right)^{2} x_{j}^{i} θj=θj−αm11∑m(h(xi)−yi)2xji
def gradientDescent(X,y,theta,alpha,iters):#iters 迭代次数
    temp = np.matrix(np.zeros(theta.shape))
    parameters = int(theta.ravel().shape[1])
    cost = np.zeros(iters)

    for i in range(iters):
        error = (X * theta.T) - y

        for j in range(parameters):
            term = np.multiply(error,X[:,j])
            temp[0,j] = theta[0,j] - ((alpha / len(X)) * np.sum(term))

        theta = temp
        cost[i] = computeCost(X,y,theta)

    return theta, cost
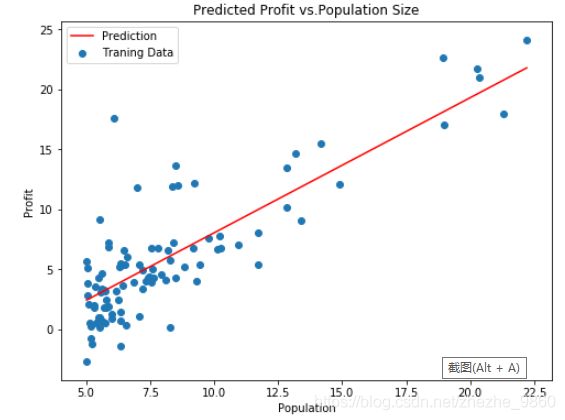
- 可视化显示:
x = np.linspace(data.Population.min(), data.Population.max(),100)
f = g[0,0] + (g[0,1] * x)

fig,ax = plt.subplots(figsize=(8,6))
ax.plot(x,f,'r',label='Prediction')
ax.scatter(data.Population,data.Profit,label='Traning Data')
ax.le()gend(loc=2)
ax.set_xlabel('Population')
ax.set_ylabel('Profit')
ax.set_title('Predicted Profit vs.Population Size')
plt.show
- 查看训练进程:
fig,ax = plt.subplots(figsize=(8,6))
ax.plot(np.arange(iters),cost,'r')
ax.set_xlabel('Iterations')
ax.set_ylabel('Cost')
ax.set_title('Error vs. Training Epoch')
plt.show()
1.3 多变量线性回归 Liner Regression with Multiple Variable
- 考虑房屋具有多个属性变量时(房间大小、卧室数量)预测房屋价格
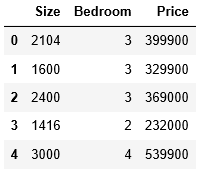
- 读取数据:
path = 'ex1data2.txt'
data2 = pd.read_csv(path, header = None,names=['Size','Bedroom','Price'])
data2.head()
- 特征缩放:
data2 = (data2 - data2.mean())/data2.std()
data2.head()
- 增加一列并计算代价值:
cols = data2.shape[1]
X2 = data2.iloc[:,0:cols-1]
y2 = data2.iloc[:,cols-1:cols]

#将X2 y2 转换为numpy矩阵 并 初始化theta2
X2 = np.matrix(X2.values)
y2 = np.matrix(y2.values)
theta2 = np.matrix(np.array([0,0,0]))

g2, cost2 = gradientDescent(X2, y2, theta2, alpha, iters)
computeCost(X2, y2, g2)
-查看训练进程:
fig2,ax = plt.subplots(figsize=(4,3)) #subplots 加s!!!!!!
ax.plot(np.arange(iters), cost2, 'r')
ax.set_xlabel('Iteration')
ax.set_ylabel('Cost')
ax.set_title('Error vs. Training Epoch2')
plt.show()


