matlab 含阻力单摆微分方程可视化
文章目录:
- 1.简介
- 2.效果
- 3.基本步骤
- 3.1 解方程
- 3.2 背景绘制
- 3.3计算并绘图
- 3.4完整代码
1.简介
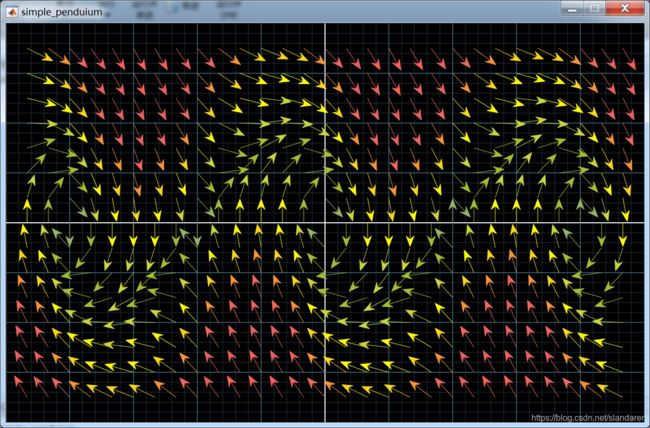
这是一期将单摆微分方程可视化的博文,我们都知道单摆常微分方程求解过程中会涉及到椭圆积分,难以用常见函数表示其结果,所以我们这篇博文想办法将其数值解可视化。
2.效果

其中横坐标为: θ ( t ) , θ ( t ) ∈ [ − 2.5 π , 2.5 π ] \theta(t),\theta(t)\in[-2.5\pi,2.5\pi] θ(t),θ(t)∈[−2.5π,2.5π]
纵坐标为: θ ˙ ( t ) , θ ˙ ( t ) ∈ [ − 2 π , 2 π ] \dot{\theta}(t),\dot{\theta}(t)\in[-2\pi,2\pi] θ˙(t),θ˙(t)∈[−2π,2π]
3.基本步骤
3.1 解方程
首先我们有微分方程:
θ ¨ ( t ) = − μ θ ˙ ( t ) − g L s i n ( θ ( t ) ) \ddot{\theta}(t)=-\mu\dot{\theta}(t)-\frac g Lsin(\theta(t)) θ¨(t)=−μθ˙(t)−Lgsin(θ(t))
我们将其变形得到微分方程组:
d d t [ θ ( t ) θ ˙ ( t ) ] = [ θ ˙ ( t ) θ ¨ ( t ) ] = [ θ ˙ ( t ) − μ θ ˙ ( t ) − g L s i n ( θ ( t ) ) ] \frac d {dt} \begin{bmatrix} \theta(t)\\\dot{\theta}(t) \end{bmatrix}= \begin{bmatrix} \dot{\theta}(t)\\\ddot{\theta}(t) \end{bmatrix}= \begin{bmatrix} \dot{\theta}(t)\\-\mu\dot{\theta}(t)-\frac g Lsin(\theta(t)) \end{bmatrix} dtd[θ(t)θ˙(t)]=[θ˙(t)θ¨(t)]=[θ˙(t)−μθ˙(t)−Lgsin(θ(t))]
对此我们均匀的在平面上取点,并计算不同 [ θ ( t ) θ ˙ ( t ) ] \begin{bmatrix} \theta(t)\\\dot{\theta}(t) \end{bmatrix} [θ(t)θ˙(t)]对应的 d d t [ θ ( t ) θ ˙ ( t ) ] \frac d {dt} \begin{bmatrix} \theta(t)\\\dot{\theta}(t) \end{bmatrix} dtd[θ(t)θ˙(t)]就可完成微分方程的可视化。
3.2 背景绘制
如果你看过我之前写的小游戏,可会下意识的这样写:
axis([-2.5,2.5,-2,2].*pi)
set(gca,‘color’,[0 0 0.0078])
set(gca,‘xtick’,[],‘ytick’,[],‘xcolor’,‘w’,‘ycolor’,‘w’)
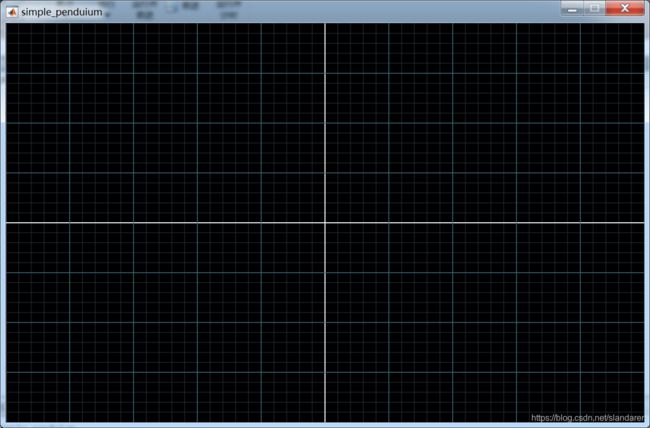
但这样写后的效果是这个样子的:

很明显不够高端大气,至少不如效果图里显得大气
我们不妨重新定义一个大的figure,并且重新设置axes大小:
penduium.fig=figure(‘units’,‘pixels’,…
‘position’,[350 100 800 500],…
‘Numbertitle’,‘off’,…
‘menubar’,‘none’,…
‘resize’,‘off’,…
‘name’,‘simple_penduium’,…
‘color’,[0.95 0.95 0.95]);
axes(‘position’,[0 0 1 1])
axis([-2.5,2.5,-2,2].*pi)
set(gca,‘color’,[0 0 0.0078])
set(gca,‘xtick’,[],‘ytick’,[],‘xcolor’,‘w’,‘ycolor’,‘w’)
像这样的到的背景长这样:

没有边框帅气很多,之后我们(残暴的)为其增添坐标系:
hold on
plot([1;1]*(-2.5:0.1:2.5).*pi,[-2;2]*ones(1,51).*pi,'color',[0.1569 0.2039 0.1882],'linewidth',0.01)
plot([-2.5;2.5]*ones(1,41).*pi,[1;1]*(-2:0.1:2).*pi,'color',[0.1569 0.2039 0.1882],'linewidth',0.01)
plot([-2.5;2.5].*pi,[0 0],'color',[0.9373 0.9569 0.9569],'linewidth',1)
plot([0 0],[-2;2].*pi,'color',[0.9373 0.9569 0.9569],'linewidth',1)
plot([-2.5;2.5]*ones(1,6).*pi,[1;1]*[1.5,1,0.5,-0.5,-1,-1.5].*pi,'color',[0.2353 0.4235 0.4745],'linewidth',0.8)
plot([1;1]*[2,1.5,1,0.5,-0.5,-1,-1.5 -2].*pi,[-2;2]*ones(1,8).*pi,'color',[0.2353 0.4235 0.4745],'linewidth',0.8)
3.3计算并绘图
只需要 写一个双层for循环计算方向向量,将其归一化后画在图中,并且根据不同的长度为其赋予不同的颜色就好了
for i=(-2.5+1/6:1/6:2.5-1/6).*pi
    for j=(-2+1/4:1/4:2-1/4).*pi
        a=f([i,j],M,g,L);
        len=norm(a);
        a=a/len;
        a=a.*vector_len;
        Spoint=pos_exchange([i,j]);
        Epoint=pos_exchange([i,j]+a);
        if ~any(isnan(a))
            annotation('arrow',[Spoint(1),Epoint(1)],[Spoint(2),Epoint(2)],...
            'color',color_exchange(len,max_len,color_map),...
            'linewidth',0.2)
        end
    end
end
其中f,pos_exchange,color_exchange三个匿名函数为:
%=========================================================
 f=@(theta,M,g,L) [theta(2),-M*theta(2)-g/L*sin(theta(1))];
%theta(1) ->theta
%theta(2) ->theta'
%==============================================
 pos_exchange=@(pos) pos./[pi*5,pi*4]+[0.5,0.5];
%==============================================
 color_map=[0.9725    0.3804    0.3529
            0.9725    0.3804    0.3529
            0.9020    0.3843    0.3765
            0.9020    0.3843    0.3765
            0.9333    0.4118    0.3765
            0.9686    0.5804    0.2235
            0.9765    0.8392    0.1098
            0.9882    0.9804    0.0588
            0.7961    0.8353    0.2510
            0.6510    0.7373    0.2000
            0.5961    0.7059    0.4039];
 color_exchange=@(value,maxvalue,color_map) color_map(12-(floor(value/(maxvalue/11))+1),:);
%=========================================================================================
3.4完整代码
function simple_penduium
M=1.4;
g=9.8;
L=2;
vector_len=0.75;
%=========================================================
 f=@(theta,M,g,L) [theta(2),-M*theta(2)-g/L*sin(theta(1))];
%theta(1) ->theta
%theta(2) ->theta'
%==============================================
 pos_exchange=@(pos) pos./[pi*5,pi*4]+[0.5,0.5];
%==============================================
 color_map=[0.9725    0.3804    0.3529
            0.9725    0.3804    0.3529
            0.9020    0.3843    0.3765
            0.9020    0.3843    0.3765
            0.9333    0.4118    0.3765
            0.9686    0.5804    0.2235
            0.9765    0.8392    0.1098
            0.9882    0.9804    0.0588
            0.7961    0.8353    0.2510
            0.6510    0.7373    0.2000
            0.5961    0.7059    0.4039];
 color_exchange=@(value,maxvalue,color_map) color_map(12-(floor(value/(maxvalue/11))+1),:);
%=========================================================================================
max_len=norm(f([pi/2,2*pi],M,g,L));
global penduium
penduium.fig=figure('units','pixels',...
    'position',[350 100 800 500],...
    'Numbertitle','off',...
    'menubar','none',...
    'resize','off',...
    'name','simple_penduium',...
    'color',[0.95 0.95 0.95]);
axes('position',[0 0 1 1])
axis([-2.5,2.5,-2,2].*pi)
set(gca,'color',[0 0 0.0078])
set(gca,'xtick',[],'ytick',[],'xcolor','w','ycolor','w')
hold on


plot([1;1]*(-2.5:0.1:2.5).*pi,[-2;2]*ones(1,51).*pi,'color',[0.1569 0.2039 0.1882],'linewidth',0.01)
plot([-2.5;2.5]*ones(1,41).*pi,[1;1]*(-2:0.1:2).*pi,'color',[0.1569 0.2039 0.1882],'linewidth',0.01)
plot([-2.5;2.5].*pi,[0 0],'color',[0.9373 0.9569 0.9569],'linewidth',1)
plot([0 0],[-2;2].*pi,'color',[0.9373 0.9569 0.9569],'linewidth',1)
plot([-2.5;2.5]*ones(1,6).*pi,[1;1]*[1.5,1,0.5,-0.5,-1,-1.5].*pi,'color',[0.2353 0.4235 0.4745],'linewidth',0.8)
plot([1;1]*[2,1.5,1,0.5,-0.5,-1,-1.5 -2].*pi,[-2;2]*ones(1,8).*pi,'color',[0.2353 0.4235 0.4745],'linewidth',0.8)


for i=(-2.5+1/6:1/6:2.5-1/6).*pi
    for j=(-2+1/4:1/4:2-1/4).*pi
        a=f([i,j],M,g,L);
        len=norm(a);
        a=a/len;
        a=a.*vector_len;
        Spoint=pos_exchange([i,j]);
        Epoint=pos_exchange([i,j]+a);
        if ~any(isnan(a))
            annotation('arrow',[Spoint(1),Epoint(1)],[Spoint(2),Epoint(2)],...
            'color',color_exchange(len,max_len,color_map),...
            'linewidth',0.2)
        end
    end
end
%text(pi,-0.1,'\pi','fontsize',20,'color','w','HorizontalAlignment', 'center')
%text(-pi,-0.1,['-','\pi'],'fontsize',20,'color','w','HorizontalAlignment', 'center')
%text(2*pi,-0.1,'  \pi','fontsize',20,'color','w','HorizontalAlignment', 'center')
%text(2*pi-0.1,-0.18,'2','fontsize',13,'color','w','HorizontalAlignment', 'center')
%text(-2*pi,-0.1,'- \pi','fontsize',20,'color','w','HorizontalAlignment', 'center')
%text(-2*pi-0.08,-0.18,'2','fontsize',13,'color','w','HorizontalAlignment', 'center')
%text(2.5*pi-0.3,0.5,'\theta','fontsize',25,'color','w','HorizontalAlignment', 'center')
%text(0.5,2*pi-0.3,['\theta','’'],'fontsize',25,'color','w','HorizontalAlignment', 'center')
end
