K—means(K-均值聚类算法)
K-means算法简介
K-means是一种无监督的聚类算法,其中的k代表类簇个数,means代表类簇内数据对象的均值(这种均值是一种队类簇中心的描述。K-means算法以距离作为数据对象间相似度的衡量标准,即数据对象间的距离越小,则它们的相似性越高,即它们越有可能在同一个类簇。
k-means算法基本原理
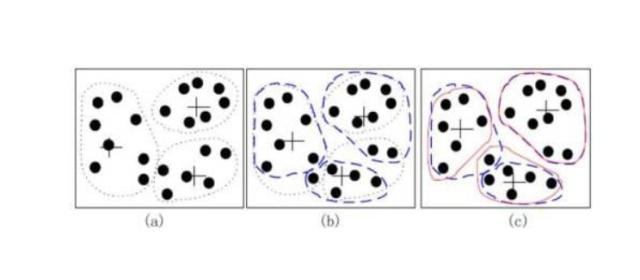
kmeans算法又名k均值算法。其算法思想大致为:先从样本集中随机选取 k 个样本作为簇中心,并计算所有样本与这 k 个“簇中心”的距离,对于每一个样本,将其划分到与其距离最近的“簇中心”所在的簇中,对于新的簇计算各个簇的新的“簇中心”。
根据以上描述,我们大致可以猜测到实现kmeans算法的主要三点:
- 簇个数 k的选择以及每个聚类初始聚类中心的选择
- 各个样本点到“簇中心”的距离
- 将样本按照最小距离原则分配到最近的邻近聚类,并根据新划分的簇,更新“簇中心,
- 重复上一个步骤,直到聚类中心不再发生变化;
- 输出最终的聚类中心和k个簇划分
![]()
kmeans算法的要点
(1) k 值的选择
k 的选择一般是按照对数据的先验经验选择一个合适的k值,如果没有什么先验知识,则可以通过交叉验证选择一个合适的k值。。
2) 在确定了k的个数后,我们需要选择k个初始化的质心,就像上图b中的随机质心。由于我们是启发式方法,k个初始化的质心的位置选择对最后的聚类结果和运行时间都有很大的影响,因此需要选择合适的k个质心,最好这些质心不能太近
给定样本
现在我们来总结下传K-Means算法的具体流程。
输入是样本集D={x1,x2,...xm} ,D={x1,x2,...xm},聚类的簇树k,最大迭代次数N
输出是簇划分C={C1,C2,...Ck}C={C1,C2,...Ck}
![]() 其中距离的度量方法主要分为以下几种:
其中距离的度量方法主要分为以下几种:
1) 从数据集D中随机选择k个样本作为初始的k个质心向量: {μ1,μ2,...,μk}{μ1,μ2,...,μk}
2)对于n=1,2,...,N
a) 将簇划分C初始化为![]()
b) 对于i=1,2...m,计算样本xixi和各个质心向量![]() 的距离:
的距离:![]() ,将
,将![]() 标记最小的为dijdij所对应的类别λiλi。此时更新
标记最小的为dijdij所对应的类别λiλi。此时更新![]()
c) 对于j=1,2,...,k,对CjCj中所有的样本点重新计算新的质心![]()
e) 如果所有的k个质心向量都没有发生变化,则转到步骤3)
3) 输出簇划分C={C1,C2,...Ck}
代码:
import numpy as np
import random
import matplotlib.pyplot as plt


# Lloyd's algorithm
# inner loop step 1
def cluster_points(X, mu):
    clusters = {}  # store k centers, type: dict

    for x in X:
        # bestmukey is "int" type
        # for i in enumerate(mu):
        #     print ((i[0], np.linalg.norm(x-mu[i[0]])))
        bestmukey = min([(i[0], np.linalg.norm(x - mu[i[0]])) \
                         for i in enumerate(mu)], key=lambda t: t[1])[0]
        # A new built-in function, enumerate(), will make certain loops a bit clearer.
        # enumerate(thing), where thing is either an iterator or a sequence,
        # returns a iterator that will return (0, thing[0]), (1, thing[1]), (2, thing[2]), and so forth.
        # key=lambda t:t[1] is used for sort this dict by t:t[1] (the second element in this element)

        try:
            clusters[bestmukey].append(x)
        except KeyError:
            clusters[bestmukey] = [x]
    return clusters


# inner loop step 2, (update the mu)
def reevaluate_centers(mu, clusters):
    newmu = []
    keys = sorted(clusters.keys())
    for k in keys:
        print len(clusters[k])
        newmu.append(np.mean(clusters[k], axis=0))

    return newmu


def has_converged(mu, oldmu):
    # A tuple is a sequence of immutable Python objects.
    # tuple is using (), list is using [], dict is using {}
    return (set([tuple(a) for a in mu]) == set([tuple(a) for a in oldmu]))


def find_centers(X, K):
    # Initialize to K random centers
    oldmu = random.sample(X, K)
    mu = random.sample(X, K)

    while not has_converged(mu, oldmu):
        oldmu = mu
        # Assign all points in X to clusters
        clusters = cluster_points(X, mu)
        # Reevaluate centers (update the centers)
        mu = reevaluate_centers(oldmu, clusters)
    return (mu, clusters)


# The initial configuration of points for the algorithm is created as follows:
def init_board(N):
    # random.uniform:
    # Draw samples from a uniform distribution
    X = np.array([(random.uniform(-1, 1), random.uniform(-1, 1)) for i in range(N)])

    return X


# The following routine constructs a specified number of Gaussian distributed clusters with random variances:
def init_board_gauss(N, k):
    n = float(N) / k
    X = []
    for i in range(k):
        c = (random.uniform(-1, 1), random.uniform(-1, 1))
        s = random.uniform(0.05, 0.5)
        x = []
        while len(x) < n:
            a, b = np.array([np.random.normal(c[0], s), np.random.normal(c[1], s)])
            # Continue drawing points from the distribution in the range [-1,1]
            if abs(a) < 1 and abs(b) < 1:
                x.append([a, b])
        X.extend(x)
    X = np.array(X)[:N]
    return X


if __name__ == "__main__":
    X = init_board(100)
    K = 4
    mu, clusters = find_centers(X, K)

    x = []
    y = []
    for i in range(K):
        lx = []
        ly = []
        for l0 in clusters[i]:
            lx.append(l0[0])
            ly.append(l0[1])
        x.append(lx)
        y.append(ly)

    for i in range(K):
        plt.plot(x[i], y[i], 'o')
        plt.plot(mu[i][0], mu[i][1], 's', markersize=10)

    plt.show()
