Debugging Flex and PHP
(Source: http://corlan.org/debugging-flex-and-php/ )
Debugging Flex and PHP
As your projects grow in size and more people get involved you’ll find yourself fixing more and more bugs. When this happens, one of the best friends a developer has is the debugger. In this paper, I’ll talk about some of the workflows and tools you can use to debug Flex and PHP projects.
If you want to try the steps outlined here for yourself, you’ll need Flash Builder 4, a PHP and MySQL server (MAMP or WAMP will do just fine), Eclipse PDT, and XDebug.
On March 24th I did a webinar on this subject. You can watch the recording over here.
- Installing the sample project
- Adding the Zend Framework
- Importing the sample project
- Setting up the PHP service files
- Setting up the database
- Configuring paths
- Configuring the output folder
- Using Flash Builder 4 features for debugging
- Network Monitor
- Test Operation
- Flash Builder 4 debugger
- Debugging the PHP code
- Using XDebug, Eclipse PDT, and Flash Builder 4 to debug Flex and PHP code
- Installing and configuring XDebug
- Installing Eclipse PDT and Flash Builder 4 together
- Using XDebug, Eclipse PDT, and Flash Builder
- Other techniques
- Where to go from here
Installing the sample project
In this article I’ll use a simple Flex and PHP project that displays data from a MySQL database. The data is retrieved via remoting using the Zend AMF part of the Zend Framework. If you don’t know what remoting is, see Flex and PHP: remoting with Zend AMF.
On the server side I have a simple PHP class (MyService.php) that implements CRUD operations for a single database table. I wrap each record into a PHP data object (VOAuthor.php). On the client side, I have a simple UI for displaying the data (in a data grid) and editing a record (in a form). Most of the Flex client was created using the data-centric development (DCD) features from Flash Builder 4. (For more on DCD, see Working in Flash Builder 4 with Flex and PHP.)
Download the project from here: http://corlan.org/downloads/flex_project.zip.
If you don’t already have Flash Builder 4, download the plug-in or standalone version from here.
[top]
ADDING THE ZEND FRAMEWORK
As a first step, you’ll need to add the Zend Framework to your server.
- In Flash Builder 4, choose File > New > Flex Project.
- Give the project a name and select PHP for the Application Server Type.
- Click Next.
- On the next screen specify the path to your web root and the root URL.
- Click Finish.
- After Flash Builder 4 creates the project, click Connect to Data/Service in the Data/Services view.
- Select PHP as the Service Type and click Next.
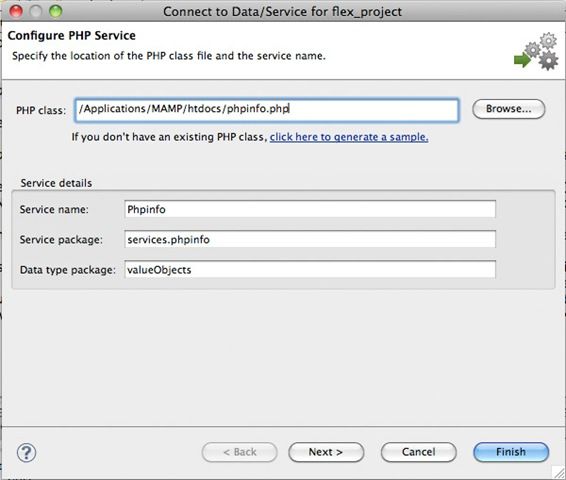
- For the PHP class select a PHP file from your webroot (see Figure 1). For example, if you have a WAMP installation, you should have an index.php file in your www folder.
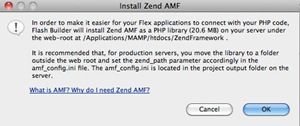
- Click Finish and a confirmation window opens asking you to install the Zend Framework(see Figure 2). Click OK.
- Another confirmation window will confirm the installation of the Zend Framework. Click OK.
- You can then cancel the Connect to Data/Service wizard and you can delete the project too.
Figure 1. The Connect to Data/Service wizard
Figure 2. Installing the Zend Framework
If you open up your web root folder, you should now see a ZendFramework folder.
[top]
IMPORTING THE SAMPLE PROJECT
You’re now ready to import the sample project.
- In Flash Builder 4, choose File > Import > Flash Builder Project.
- Click on the Browse button and navigate to the flex_project.zip file you downloaded earlier.
- Click Open and then click Finish.
[top]
SETTING UP THE PHP SERVICE FILES
Now that you have the project imported, you’ll need to make some changes in order to make it run.
- Using Explorer (Windows) or Finder (Mac OS X), move the zendamf_remote folder from the project directory to your web root folder.
- Back in Flash Builder 4 delete the zendamf_remote folder.
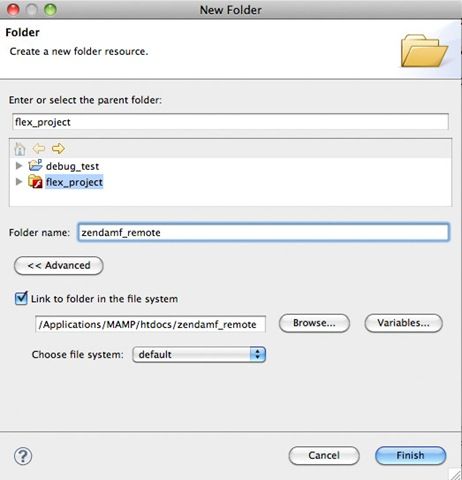
- Choose File > New > Folder. Click Advanced and then select Link To Folder In The File System. Click Browse and select the zendamf_remote folder from your web server root (see Figure 3).
Figure 3. Creating a linked resource to the zendamf_remote folder
Next you need to define the linked resource to the MyService.php file.
4. In Flash Builder, open the services folder and delete the MyService.php node.
5. Right-click the services folder and choose New > File.
6. Click Advanced and then select Link To File In The File System.
7. Browse to select the MyService.php file from the zendamf_remote folder in your web root folder.
[top]
SETTING UP THE DATABASE
Inside the project you’ll find a file called sql_dump.txt. Use this file to create the authors_aut table and to populate it with data.
Next edit the zendamf_remote/MyService.php file and update the credentials used for connecting to the database (at the top of the file you’ll find constants for server host, database name, user, and password).
[top]
CONFIGURING PATHS
Now you’ll need to configure the paths used by this project for web root and the Zend Framework. In Package Explorer double-click the bin-debug/amf_config.ini file. Edit the following lines and make sure the values point to your web root and Zend Framework. For example, on a Windows machine with WAMP, these lines may look like this (make sure they do not start with “;”):
webroot =C:/wamp/www
zend_path = c:/wamp/www/ZendFramework
[top]
CONFIGURING THE OUTPUT FOLDER
- Lastly, you need to set the output folder of the project.
- Right-click the project name in the Package Explorer and select Properties.
- Select the Flex Server node from the list.
- For the Output Folder add the path to your webroot followed by “/flex_project-debug”.
- On my WAMP configuration the path is C:/wamp/www/flex_project-debug.
- Click Validate Configuration and then Apply and OK.
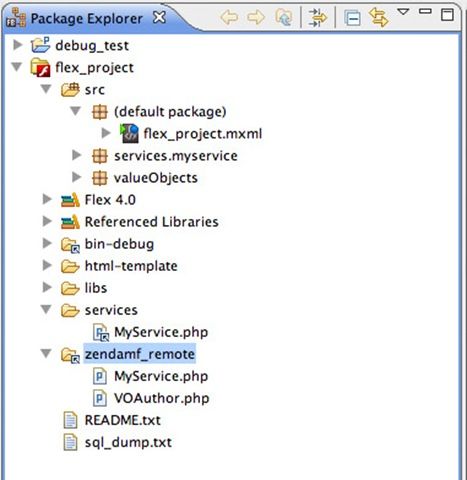
Figure 4 shows the project after these steps.
Figure 4. The flex_project project in Flash Builder 4.
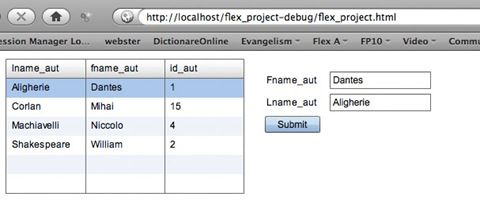
Now you are ready to run the project (choose Run > Run flex_project). Once the application is loaded in the browser, you should be able to see the records displayed in the data grid and to edit them.
Figure 5. Running the application
[top]
Using Flash Builder 4 features for debugging
There are (at least) three different ways to debug your code using Flash Builder 4 (please note that I use the term debugging here in a broad sense).
Two new views in Flash Builder 4 help you to debug your code: the Network Monitor and Test Operation views. If don’t see these you views you can add them by choosing Window > Other Views and expanding the Flash Builder node (Network Monitor is available only in Flash Builder Premium).
[top]
NETWORK MONITOR
Using the Network Monitor view you can see all the communication between the Flex client and the server. You can see both the raw data and the objects. If you want to use it, you must enable it first by clicking on the Enable Monitor icon in Network Monitor view (see Figure 6).
Figure 6. Enabling the Network Monitor
Now, just run the application (you don’t have to run it in debug mode). As you use the application and data are exchanged with the server, you should see each request, how long it took, and all the data that was sent/received (see Figure 7).
Figure 7. Using the Network Monitor
[top]
TEST OPERATION
The Test Operation view, as the name implies, lets you to test the available operations. In Test Operation view, select the getData() operation, and click Test. You should see the four VOAuthor objects (see Figure 8). If the operation expects arguments, then this view lets you define the arguments values.
Figure 8. Using Test Operation
[top]
FLASH BUILDER 4 DEBUGGER
The most powerful way to detect bugs is, of course, debugging. The Flash Builder debugger is a powerful tool that can help you quickly pinpoint and resolve bugs.
Let’s see how you can debug the Flex and PHP code. First run the project in debug mode. There are a number of ways to do this:
- If you are in the Flash perspective you can click the Debug toolbar button.
- You can also right-click flex_project.mxml and choose Debug As > Web Application.
- Or, you can choose Run > Debug flex_project.
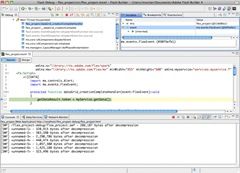
This will start the debugger. If you set a breakpoint inside the dataGrid_creationcompleteHandler() function and run in debug mode you should see the debugger in action (see Figure 9).
Figure 9. Flash Builder debugger in action
[top]
Debugging the PHP code
What about debugging the PHP code? First of all, you should check that you don&rsqu o;t have errors in your PHP services (classes). You might have misspelled a variable or function name, or used the wrong credentials for connecting to MySQL, and so on. Then, if you add some initialization code and make a call to the method you want to test you can test the execution of the code.
For example, with my setup I could load the following URL in a browser: http://localhost/zendamf_remote/MyService.php .
This is the URL to the PHP service. If there are no syntax errors, then I can check that getData() returns what I expect to by adding this code above the class definition:
$service = new MyService();
print_r($service->getData());
PHP developers have been using a combination of var_dump() and die() for years in order to see what is happening with our PHP scripts. But how can you use this approach when you’re working with Flex and PHP? Instead of just dumping variables on the screen, you can have a logging function that dumps the variables into a text file. For example, I use this function:
function logMe($var) {
$filename = dirname(__FILE__) . '/__log.txt';
if (!$handle = fopen($filename, 'a')) {
echo "Cannot open file ($filename)";
return;
}
$toSave = var_export($var, true);
fwrite($handle, "[" . date("y-m-d H:i:s") . "]");
fwrite($handle, "/n");
fwrite($handle, $toSave); fwrite($handle, "/n");
fclose($handle);
}
Then, if I want to log, for example, the argument that Flex sends when the saveData() method is called, I just add this line inside of the saveData() method, run the Flex application, and edit a row:
logMe($author);
If you try this, you’ll see something like this in the log file (you can find the log file in the zendamf_remote folder):
[10-02-18 14:20:01] stdClass::__set_state(array( 'lname_aut' => 'Corlan', 'fname_aut' => 'Mihai', 'id_aut' => '15', ))
[top]
Using XDebug, Eclipse PDT, and Flash Builder 4 to debug Flex and PHP code
What about actually debugging the code using a PHP and Flex debugger? I think this is by far the most powerful and fast method to pinpoint issues in your application, especially when dealing with client-server applications.
For this part you’ll need some additional tools besides Flash Builder 4: XDebug for debugging the PHP code, and Eclipse PDT used as a client for XDebug (of course you can also use it for editing PHP files).
[top]
INSTALLING AND CONFIGURING XDEBUG
You can get Windows binaries of the XDebug from the project website. Unfortunately, if you need it for another platform you have to grab the source and compile it for your platform or look somewhere else. After I searched a little bit, I found that you can find binaries for other platforms at the ActiveState website.
Once you extract the archive for your operating system, you’ll find XDebug versions for different PHP versions. On my machine I’m running PHP 5.2.6, so I used xdebug.so for PHP 5.2.
With my MAMP server I copied the xdebug.so file to /Applications/MAMP/bin/php5/lib/php/extensions/no-debug-non-zts-20050922/ and then I open up the php.ini file (from /Applications/MAMP/conf/php5/) and added these lines at the end of the file:
[xdebug]
zend_extension=/Applications/MAMP/bin/php5/lib/php/extensions/no-debug-non-zts-20050922/xdebug.so
If you have configured the Zend debugger, then you’ll need to comment those lines. Save the php.ini file and restart the Apache server. If you run a phpinfo() script you should see an entry called XDebug.
Next, you need to configure the XDebug. Under the previous lines in php.ini, just add these lines:
xdebug.remote_enable=On
xdebug.remote_host="localhost"
xdebug.remote_port=9000
xdebug.remote_handler="dbgp"
Make sure you match the remote_host with your configuration, and make sure you set a remote_port that it is not used by other applications running on your machine.
Save the file and restart the server.
[top]
INSTALLING ECLIPSE PDT AND FLASH BUILDER 4 TOGETHER
I like using modern IDEs not only for writing code, but for debugging too. One good client for XDebug is Eclipse PDT (Eclipse PHP Development Tools). You can download PDT from here.
The beauty of using Eclipse-based IDEs is that you can install multiple products together in the same Eclipse environment. In this case, you have two choices: either install the Flash Builder 4 plug-in on top of Eclipse PDT, or grab the update link of Eclipse PDT and install it on top of your Flash Builder 4 standalone installation.
On my machine I chose the first option. If you are on a Mac, you have to grab the Mac OS X Carbon version of Eclipse PDT because Flash Builder 4 is available only for Carbon.
Once you have these two IDEs installed together you can have combined Flex and PHP projects (projects that have both Flex and PHP natures). The easiest way to create such a project is to start with a new PHP project and then apply Flex nature (Right-click the project name and choose Add/Change Project Type > Add Flex Project type. When the wizard starts make sure you select PHP as the application server type.)
Note: the project used for this article was created using this approach, so it has both natures.
[top]
USING XDEBUG, ECLIPSE PDT, AND FLASH BUILDER
Actually, the hardest part of setting up debugging for Flex and PHP projects is already behind you. The last step is the creation of a PHP debug configuration for your flex_project project.
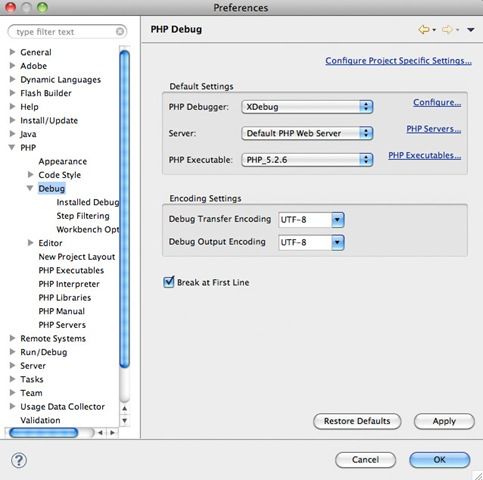
But first, let’s make some changes in the Eclipse preferences. Open the Preferences for Eclipse and select the Debug option in the PHP node. For the PHP Debugger, select XDebug (see Figure 10). If you specified a port other than 9000 for XDebug in php.ini, then you have to select Installed Debuggers (extend the Debug node) and configure the port for XDebug. Click Apply.
Figure 10. Making XDebug the default option
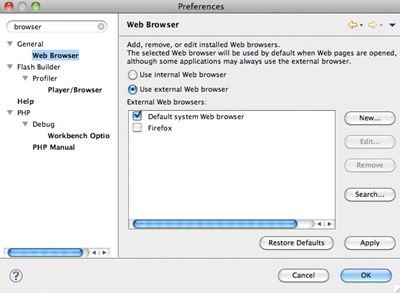
Next, type browser in the search box of the Preferences window (top-left corner), select the Web Browser entry, and check Use External Web browser option (see Figure 11). This will make Eclipse start the debugging sessions in the default web browser instead of the internal one.
Figure 11. Setting up the external web browser for debugging.
The next step is to create the Debug configuration for PHP. You’ll use this configuration to start the PHP debugger and thus once you start the Flex debugging session, the PHP debugger will connect to the same page. Click the arrow next to the Debug button (see Figure 12) and choose Debug Configurations.
Figure 12. Open Debug Configurations.
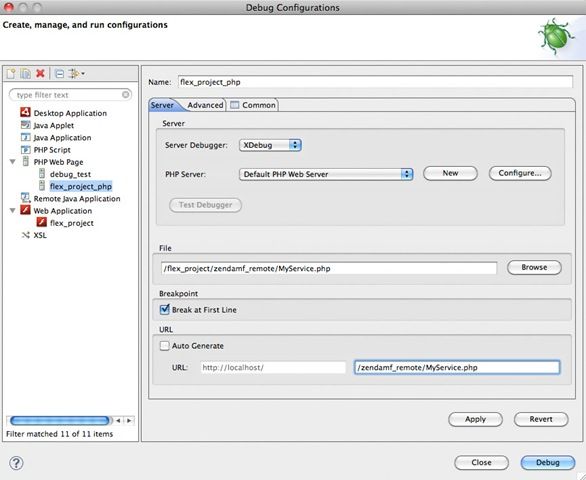
In the Debug Configurations dialog box, select PHP Web Page node from the left panel, and double-click it to create a new configuration. Type flex_project_php as the name, and then select XDebug as the Server Debugger option (see Figure 13). For the File entry select the MyService.php file from flex_project/zendamf_remote/MyService.php. Deselect the Auto Generate checkbox in the URL section, and for the URL, type the URL that points to the MyService.php file (on my machine this URL is http://localhost/zendamf_remote/MyService.php). Click Apply and then click Debug.
Figure 13. Creating the PHP debug configuration
Now that you have started the PHP debugger, place a breakpoint inside of the dataGrid_creationCompleteHandler() function from flex_project.mxml, and place another breakpoint in the flex_project/zendamf_remote/MyService.php inside of the getData() method.
Then run the Flex application in debug mode (with the Flash perspective selected, right-click flex_project.mxml and choose Debug As > Web Application). Once the application is launched in the browser you should see the Flex debugger in action and the code execution halted at the breakpoint from the dataGrid_creationCompleteHandler function (see Figure 14).
Figure 14. Flex debugger in action
Resume execution (or press F8) and you should see the PHP debugger stopped at the first line of flex_project/bind-debug/gateway.php. This is the script called by the Flex client when it uses remoting to call the MyService class. This script sets up some configuration parameters such as where the Zend Framework is installed, and then starts the Zend AMF remoting. After using Resume, you should hit the breakpoint from the getData() method of the MyService object (see Figure 15).
Figure 15. PHP debugger in action
Once you’ve done with the debugging in PHP, click Terminate (the red square button) to terminate the PHP debugging session.
[top]
Other techniques
Some people use tools like proxy sniffers (such as Charles) or Firebug to see the communication between the client and the server. These tools understand the AMF3 format, the messaging format used by remoting.
While there is nothing wrong with this approach, I feel that the new features of Flash Builder 4 (Test Operation and Networking Monitor) provide similar functionality but in an integrated package.
[top]
Where to go from here
Using Flash Builder 4 for Flex and PHP projects provides a great foundation. Add XDebug and Eclipse PDT to this and you have an even more powerful combination for development and debugging. As your projects grow in scope and complexity, you will be able to debug the Flex and PHP code more easily and at the same time.
Visit the Flex Developer Center – Learn Flex and PHP page for more articles on Flex, PHP, and AMF. And of course keep an eye on my blog. More Flex and PHP articles will come.
[top]
