1.单因子方差分析
library(reshape2)
library(car)
library(ggplot2)
library(ggpubr)
library(ggsci)
library(ggsignif)
library(userfriendlyscience)
library(psych)
 df = data.frame(A = c(7.76,7.71,8.43,8.47,10.3,6.67,11.73,5.78,6.61,6.97),
           B = c(12.14,13.6,14.42,13.85,17.53,14.16,14.94,13.01,14.18,17.72),
           C = c(10.85,8.59,7.19,9.36,9.59,8.81,8.22,9.95,11.26,8.68))
data = melt(df)
colnames(data) = c('group','ATP_expr')
as.factor(data$group)
describeBy(data$ATP_expr,data$group)
fit = aov(ATP_expr~group,data)
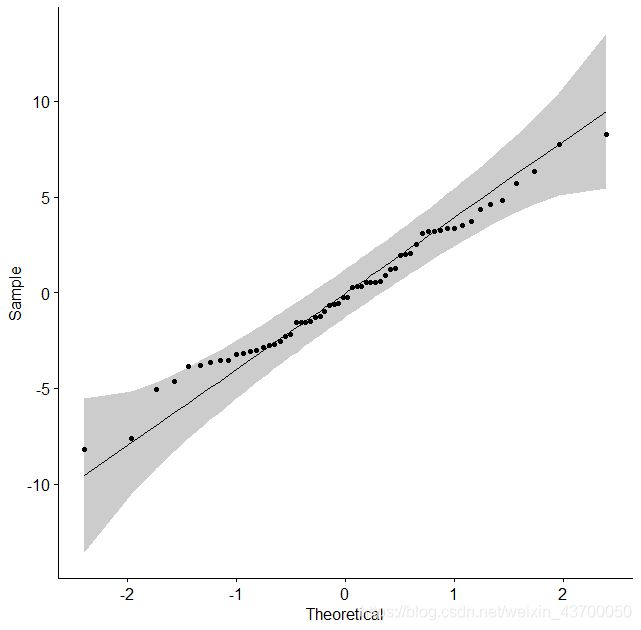
res = fit$residuals
ggqqplot(res)

leveneTest(ATP_expr~group,data)
summary(fit)
Tu = TukeyHSD(fit) # 多重比较
p = Tu$group[,4]
p.signif = ifelse(p < 0.05,
                  ifelse(p < 0.01,ifelse(p < 0.001, '***', '**'),'*'),
                  'ns')
comp = list(c('A','B'), c('A','C'), c('B','C'))
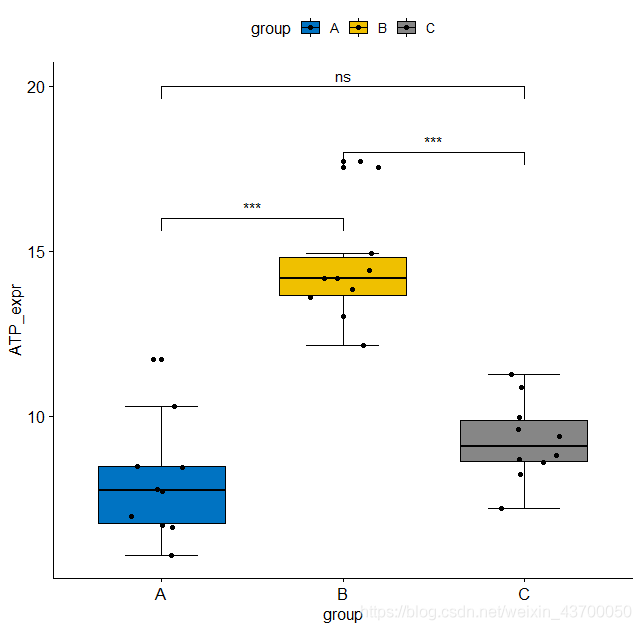
ggboxplot(data, x = "group", y = "ATP_expr",
          fill = "group",
          palette = "jco",
          bxp.errorbar = T,
          add = 'jitter',
          short.panel.labs = F) +
  geom_signif(comparisons = comp,
              y_position = c(16,20,18),
              annotations = unname(p.signif))

2.双因子方差分析
ToothGrowth$dose = as.factor(ToothGrowth$dose)
fit = aov(data = ToothGrowth,len~supp*dose)
res = fit$residuals
ggqqplot(res)

leveneTest(len~supp*dose,ToothGrowth)
summary(fit)
TukeyHSD(fit)
Tu = TukeyHSD(fit) # 多重比较
all_pvalue = Tu$`supp:dose`
rownames(all_pvalue)
p = all_pvalue[c(2,4,11,7,9,14),4]
p.signif = ifelse(p < 0.05,
                  ifelse(p < 0.01,ifelse(p < 0.001, '***', '**'),'*'),
                  'ns')
annotation <- data.frame(supp= rep(c('OJ','VC'),each =3),
                         start=c("0.5", "0.5",'1'),
                         end=c('1','2','2'),
                         y = c(34,38,36),
                         label=unname(p.signif))
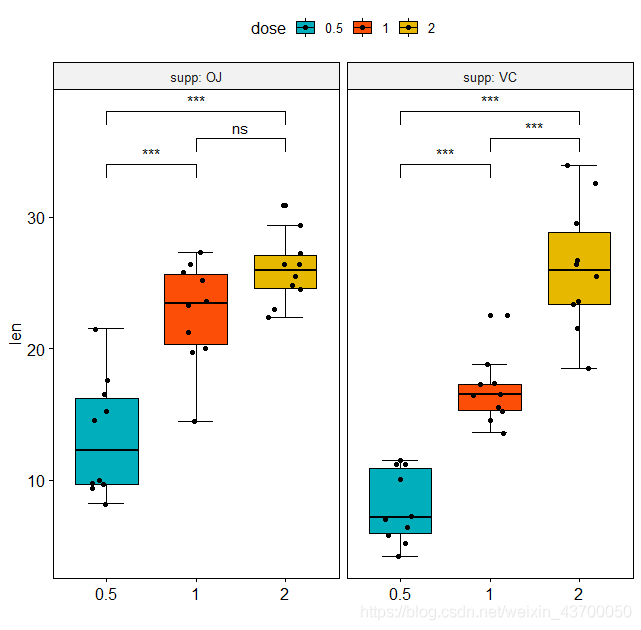
ggboxplot(ToothGrowth, x = "dose", y = "len",
          fill = "dose",
          bxp.errorbar = T,
          add = 'jitter',
          palette = c("#00AFBB", "#FC4E07", "#E7B800"), # 自定义色彩
          facet.by = "supp",
          short.panel.labs = FALSE,xlab = '') +
  geom_signif(data = annotation,
              aes(xmin=start, xmax=end, annotations=label, y_position=y),
              manual=TRUE)

ggbarplot(ToothGrowth, x = "dose", y = "len",
          fill = "dose",
          add = 'mean_se',
          palette = c("#00AFBB", "#FC4E07", "#E7B800"), # 自定义色彩
          facet.by = "supp",
          short.panel.labs = FALSE,xlab = '') +
  geom_signif(data = annotation,
              aes(xmin=start, xmax=end, annotations=label, y_position=y),
              manual=TRUE)

p1 = all_pvalue[c(1,10,15),4]
p.signif = ifelse(p1 < 0.05,
                  ifelse(p1 < 0.01,ifelse(p1 < 0.001, '***', '**'),'*'),
                  'ns')
annotation <- data.frame(dose= c(0.5,1,2),
                         start='VC',
                         end= 'OJ',
                         y = 36,
                         label=unname(p.signif))
ggboxplot(ToothGrowth, x = "supp", y = "len",
          fill = "supp",
          bxp.errorbar = T,
          add = 'jitter',
          palette = c("#00AFBB", "#FC4E07"), # 自定义色彩
          facet.by = "dose",
          short.panel.labs = FALSE,xlab = '') +
  geom_signif(data = annotation,
              aes(xmin=start, xmax=end, annotations=label, y_position=y),
              manual=TRUE)


