(RandomForestRegressor)随机森林1-天气最高温度预测
import pandas as pd
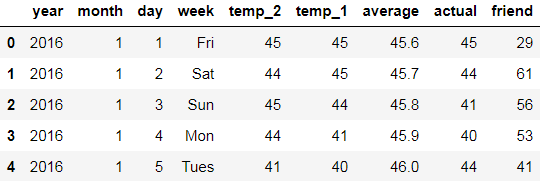
data = pd.read_csv('temps.csv')
print('The shape of our data is: ', data.shape)
data.head()
The shape of our data is: (348, 9)
import datetime

years = data['year']
months = data['month']
days = data['day']

dates=[str(int(year))+'-'+str(int(month))+'-'+str(int(day)) for year,month,day in zip(years,months,days)]
dates = [datetime.datetime.strptime(date, '%Y-%m-%d') for date in dates]
dates[:5]
[datetime.datetime(2016, 1, 1, 0, 0),
datetime.datetime(2016, 1, 2, 0, 0),
datetime.datetime(2016, 1, 3, 0, 0),
datetime.datetime(2016, 1, 4, 0, 0),
datetime.datetime(2016, 1, 5, 0, 0)]
- 更多时间操作见:
- <时间操作datetime,Timestamp,to_datetime,strptime用法>
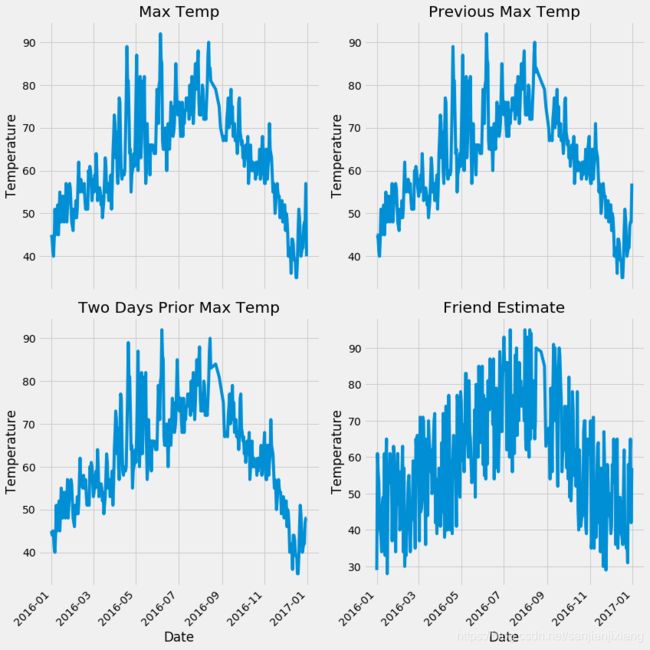
1. 数据展示
import matplotlib.pyplot as plt
%matplotlib inline
plt.style.use('fivethirtyeight')

from pandas.plotting import register_matplotlib_converters
register_matplotlib_converters()
# 防止出现 FutureWarning: Using an implicitly registered datetime converter for a matplotlib plotting method.

fig,((ax1,ax2),(ax3,ax4)) = plt.subplots(nrows=2, ncols=2, figsize=(12,12))
fig.autofmt_xdate(rotation = 45)

ax1.plot(dates, data['actual'])
ax1.set_xlabel(''); ax1.set_ylabel('Temperature'); ax1.set_title('Max Temp')

ax2.plot(dates, data['temp_1'])
ax2.set_xlabel(''); ax2.set_ylabel('Temperature'); ax2.set_title('Previous Max Temp')

ax3.plot(dates, data['temp_2'])
ax3.set_xlabel('Date'); ax3.set_ylabel('Temperature'); ax3.set_title('Two Days Prior Max Temp')

ax4.plot(dates, data['friend'])
ax4.set_xlabel('Date'); ax4.set_ylabel('Temperature'); ax4.set_title('Friend Estimate')

plt.tight_layout()
plt.show()
2. 数据预处理
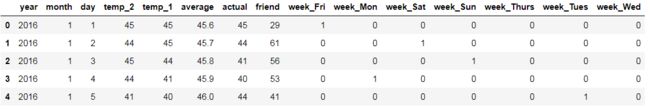
2.1 get_dummies()编码
data = pd.get_dummies(data)
data.head()
- 更多get_dummies()见:
2.2 标签与数据格式转换
import numpy as np
labels = np.array(data['actual'])
features = data.drop('actual', axis=1)
feature_list = list(features.columns)
features = np.array(features)
2.3 训练集和测试集
from sklearn.model_selection import train_test_split
train_features,test_features,train_labels,test_labels=train_test_split(features,labels,test_size=0.25,random_state=42)
print('Training Features Shape:', train_features.shape)
print('Training Label Shape:', train_labels.shape)
print('Testing Features Shape:', test_features.shape)
print('Testing Label Shape:', test_labels.shape)
Training Features Shape: (261, 14)
Training Label Shape: (261,)
Testing Features Shape: (87, 14)
Testing Label Shape: (87,)
3. 建立一个基础的随机森林模型, 并进行测试
from sklearn.ensemble import RandomForestRegressor

rfr = RandomForestRegressor(n_estimators = 100, random_state = 42)
rfr.fit(train_features, train_labels)

predictions = rfr.predict(test_features)
errors = abs(predictions - test_labels)
print('Mean Absolute Error:', round(np.mean(errors), 2), 'degrees.')
# round(x,n)函数:返回浮点数x的小数点后n位的四舍五入值
Mean Absolute Error: 3.91 degrees.
4. MAPE指标
mape = 100 * (errors / test_labels)
accuracy = 100 - np.mean(mape)
print('Accuracy:', round(accuracy, 2), '%.')
Accuracy: 93.89 %.
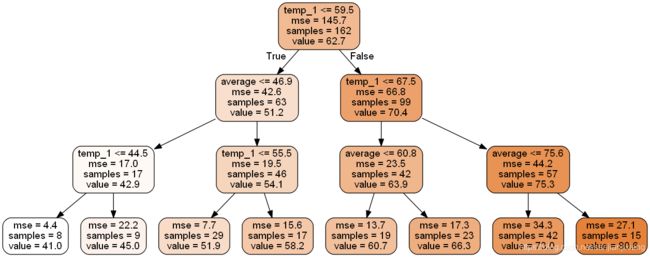
5. 可视化展示树
rfr_new = RandomForestRegressor(n_estimators=100, criterion='mse', max_depth=None,
                               min_samples_split=2,min_samples_leaf=1,random_state=42)
rfr_new.fit(features, labels)

from sklearn.tree import export_graphviz
import pydotplus
from IPython.display import Image

tree = rfr_new.estimators_[5]
dot_data = export_graphviz(tree, out_file=None, feature_names=feature_list,rounded=True,precision=1)
graph = pydotplus.graph_from_dot_data(dot_data)
graph.write_png('tree.png')
Image(graph.create_png())
print('The depth of this tree is:', tree.tree_.max_depth)
The depth of this tree is: 15
5.1 控制一下树
rfr_small = RandomForestRegressor(n_estimators=10, max_depth=3, random_state=42)
rfr_small.fit(train_features, train_labels)

tree_small = rfr_small.estimators_[5]
dot_data2=export_graphviz(tree_small,out_file=None,feature_names=feature_list,filled=True,rounded=True,precision=1)
graph = pydotplus.graph_from_dot_data(dot_data2)
Image(graph.create_png())
- 更多可视化展示见:
- <(DecisionTreeClassifier)决策树可视化实例-鸢尾花数据分类>
- <(DecisionTreeRegressor)决策树回归实例-加州房价数据>
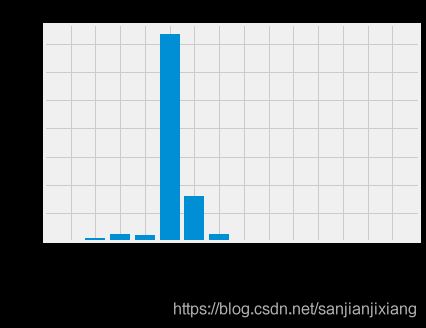
6. 特征重要性
importances = list(rfr.feature_importances_)
feature_importances=[(feature,round(importance,2)) for feature,importance in zip(feature_list,importances)]
feature_importances=sorted(feature_importances,key=lambda x:x[1], reverse=True)
[print('Variable: {:15} Importance: {}'.format(*pair)) for pair in feature_importances];
Variable: temp_1 Importance: 0.74
Variable: average Importance: 0.16
Variable: day Importance: 0.02
Variable: temp_2 Importance: 0.02
Variable: friend Importance: 0.02
Variable: month Importance: 0.01
Variable: year Importance: 0.0
Variable: week_Fri Importance: 0.0
Variable: week_Mon Importance: 0.0
Variable: week_Sat Importance: 0.0
Variable: week_Sun Importance: 0.0
Variable: week_Thurs Importance: 0.0
Variable: week_Tues Importance: 0.0
Variable: week_Wed Importance: 0.0
7. 用最重要的特征再来试试
rfr_most_important = RandomForestRegressor(n_estimators=1000, random_state=42)
important_indices = [feature_list.index('temp_1'), feature_list.index('average')] #获取重要特征的索引
train_important = train_features[:, important_indices]
test_important = test_features[:, important_indices]
# 获取重要特征的训练集和测试集

rfr_most_important.fit(train_important, train_labels)
predictions = rfr_most_important.predict(test_important)

errors = abs(predictions - test_labels)
print('Mean Absolute Error:', round(np.mean(errors), 2), 'degrees.')

mape = np.mean(100 * (errors / test_labels))
accuracy = 100 - mape
print('Accuracy:', round(accuracy, 3), '%.')
Mean Absolute Error: 3.92 degrees.
Accuracy: 93.771 %.
x_values = list(range(len(importances)))
plt.bar(x_values, importances, orientation = 'vertical')
plt.xticks(x_values, feature_list, rotation = 'vertical')
plt.ylabel('Importance'); plt.xlabel('Variable'); plt.title('Variable Importances')
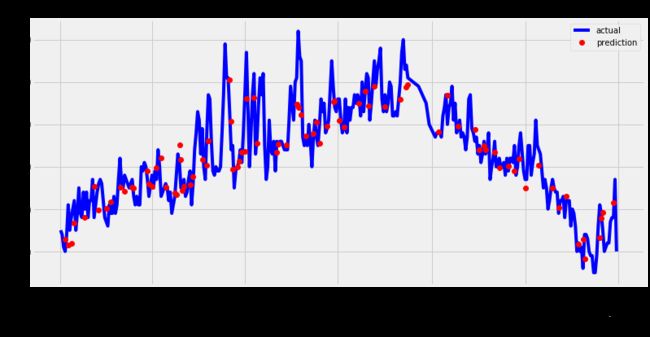
8. 预测值与真实值之间的差异
months = features[:, feature_list.index('month')]
days = features[:, feature_list.index('day')]
years = features[:, feature_list.index('year')]
dates=[str(int(year))+'-'+str(int(month))+'-'+str(int(day)) for (year,month,day) in zip(years,months,days)]
dates = [datetime.datetime.strptime(date, '%Y-%m-%d') for date in dates]

#True values and dates
true_data = pd.DataFrame(data={
     'date':dates, 'actual':labels})

#Dates of predictions
months = test_features[:, feature_list.index('month')]
days = test_features[:, feature_list.index('day')]
years = test_features[:, feature_list.index('year')]
test_dates=[str(int(year))+'-'+str(int(month))+'-'+str(int(day)) for (year,month,day) in zip(years,months,days)]
test_dates = [datetime.datetime.strptime(date, '%Y-%m-%d') for date in test_dates]
predictions_data = pd.DataFrame(data={
     'date':test_dates, 'prediction':predictions})

#画图
plt.figure(figsize = (12, 6))
plt.plot(true_data['date'], true_data['actual'], 'b-', label='actual')
plt.plot(predictions_data['date'],predictions_data['prediction'],'ro',label='prediction')
plt.xticks(rotation = '45')
plt.xlabel('Date')
plt.ylabel('Maximum Temperature(F)')
plt.title('Actual and Predicted Values')
plt.legend()
plt.show()