D3 Geospatial information visualization
你需要知道的:
JSON数据无法通过本地访问!!!换成Web服务器之后又说什么跨域访问,我真的太菜了什么都不懂。
通过Python搭建简单Web服务器
最后:这个人真的是太赞了!!!
getJSON无法读取本地json数据的问题
我用的是HBilder,所以设置了一个内置web服务器就可以访问了
- 需要知道每个城市的经纬度坐标信息:地理编码(geocoding)服务能够根据地名查找地图,返回较为精确的经纬度坐标;
- 获得GeoJSON数据:
- 1.NaturalEarth (这里可以说一下有两种数据一个是cultural:表示与文化有关的分界线(国家线) physical:物理上的分界线(海线))2.美国人口普查局(Shapefile)
- 将高解析度的数据文件转化为低解析度的数据文件:Matt Bloch MapShapper
D3.js in action 第八章
8 地理空间信息可视化 Geospatial information visualization
path.countries {
  stroke-width: 1;
  stroke: #75739F;
  fill: #5EAFC6;
}
circle.cities {
  stroke-width: 1;
  stroke: #4F442B;
  fill: #FCBC34;
}
circle.centroid {
  fill: #75739F;
  pointer-events: none;
}
rect.bbox {
  fill: none;
  stroke-dasharray: 5 5;
  stroke: #75739F;
  stroke-width: 2;
  pointer-events: none;
}
path.graticule {
  fill: none;
  stroke-width: 1;
  stroke: #9A8B7A;
}
path.graticule.outline {
  stroke: #9A8B7A;
}

path.merged {
  fill: #9A8B7A;
  stroke: #4F442B;
  stroke-width: 2px;
}
8.1 地图组件
官方API:不同的projection
8.1.1 投影 Projection
Mercator Projection

代码:
d3.json("../data/world.geojson", createMap);

function createMap(countries) {

  var aProjection = d3.geoMercator();
  var geoPath = d3.geoPath().projection(aProjection);
  //d3.geoPath()默认是albersUSA,是一种只适合USA地图的投影
  d3.select("svg").selectAll("path").data(countries.features)
    .enter()
    .append("path")
      .attr("d", geoPath)
      .attr("class", "countries");

}
8.1.2 比例 scale
在不同的投影上,有不同的技巧来确定合适的比例可以展示整个地图。
比如说对于Mercator Projection:将宽度(width)除以2,然后将商除以π;找到一个合适的比例需要经系列的实验,但是这件事器在有了zoom之后会好办很多。
var aProjection = d3.geoMercator()
  .scale(80)
  .translate([250, 250]);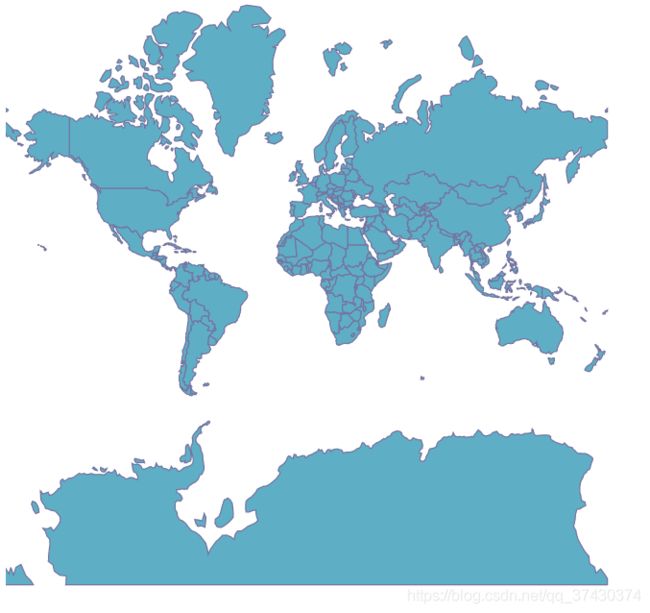
8.2 画地图
8.2.1 在地图上画点
var PromiseWrapper = (xhr, d) => new Promise(resolve => xhr(d, (p) => resolve(p)));
Promise
.all([
PromiseWrapper(d3.json, "../data/world.geojson"),
PromiseWrapper(d3.csv, "../data/cities.csv")
])
.then(resolve => {
createMap(resolve[0], resolve[1]);
});
function createMap(countries, cities) {
var projection = d3.geoMercator()
.scale(80)
.translate([250, 250]);
var geoPath = d3.geoPath().projection(projection);
d3.select("svg").selectAll("path").data(countries.features)
.enter()
.append("path")
.attr("class", "countries")
.attr("d", geoPath);
d3.select("svg").selectAll("circle").data(cities)
.enter()
.append("circle")
.attr("class", "cities")
.attr("r", 3)
.attr("cx", d => projection([d.x,d.y])[0])
.attr("cy", d => projection([d.x,d.y])[1]);
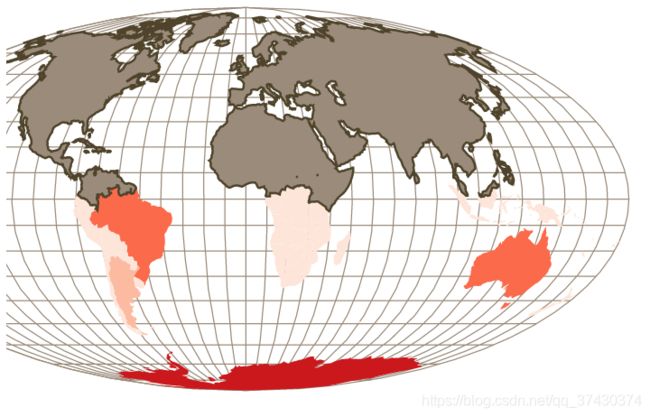
}8.2.2 在地图上描面积
Mollweide Projection:equal-area projection
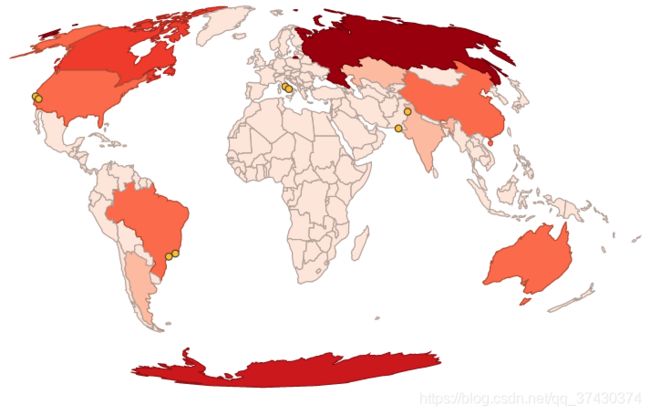
function createMap(countries, cities) {

  var projection = d3.geoMollweide()
    .scale(120)
    .translate([250, 250]);

  var geoPath = d3.geoPath().projection(projection);
  var featureSize = d3.extent(countries.features, d => geoPath.area(d))
  var countryColor = d3.scaleQuantize()
    .domain(featureSize).range(colorbrewer.Reds[7]);

  d3.select("svg").selectAll("path").data(countries.features)
    .enter()
    .append("path")
      .attr("d", geoPath)
      .attr("class", "countries")
      .style("fill", d => countryColor(geoPath.area(d)))
      .style("stroke", d => d3.rgb(countryColor(geoPath.area(d))).darker());

  d3.select("svg").selectAll("circle").data(cities)
    .enter()
    .append("circle")
      .attr("class", "cities")
      .attr("r", 3)
      .attr("cx", d => projection([d.x,d.y])[0])
      .attr("cy", d => projection([d.x,d.y])[1]);

}
8.2.3 交互
计算某个区域的边界以及中心
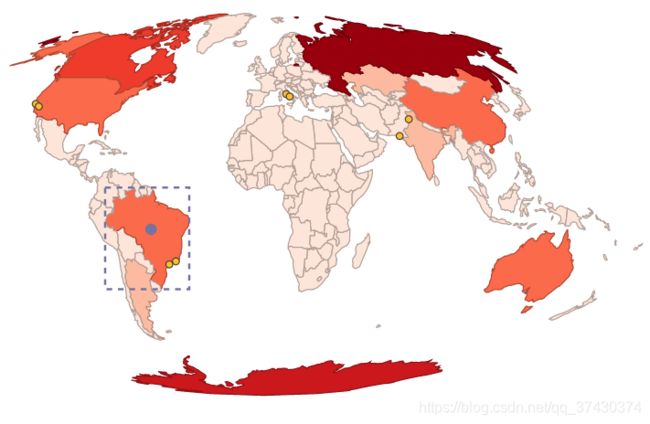
function centerBounds(d) {

  var thisBounds = geoPath.bounds(d);
  var thisCenter = geoPath.centroid(d);//获得面积中心
  console.log(thisBounds);

  d3.select("svg")
    .append("rect")
      .attr("class", "bbox")
      .attr("x", thisBounds[0][0]) //Bounds[0]表示最左边界
      .attr("y", thisBounds[0][1]) //Bounds[1]表示最右边界
      .attr("width", thisBounds[1][0] - thisBounds[0][0])
      .attr("height", thisBounds[1][1] - thisBounds[0][1]);

  d3.select("svg")
    .append("circle")
      .attr("class", "centroid")
      .attr("r", 5)
      .attr("cx", thisCenter[0]).attr("cy", thisCenter[1]);

}

function clearCenterBounds() {
  d3.selectAll("circle.centroid").remove();
  d3.selectAll("rect.bbox").remove();
}
8.3 更好的显示地图 Better mapping
8.3.1 方格图 Graticule

var graticule = d3.geoGraticule();
d3.select("svg").insert("path", "path.countries")
    .datum(graticule)
    .attr("class", "graticule line")
    .attr("d", geoPath);

d3.select("svg").insert("path", "path.countries")
    .datum(graticule.outline)
    .attr("class", "graticule outline")
    .attr("d", geoPath);
8.3.2 缩放 Zoom
var mapZoom = d3.zoom()
  .on("zoom", zoomed);

var zoomSettings = d3.zoomIdentity
  .translate(250, 250)
  .scale(120);

d3.select("svg").call(mapZoom).call(mapZoom.transform, zoomSettings);

function zoomed() {
  var e = d3.event;
  projection.translate([e.transform.x, e.transform.y])
    .scale(e.transform.k);//为projection设置新的位置以及比例
  d3.selectAll("path.graticule").attr("d", geoPath);
  d3.selectAll("path.countries").attr("d", geoPath);
  d3.selectAll("circle.cities")
      .attr("cx", d => projection([d.x,d.y])[0])
      .attr("cy", d => projection([d.x,d.y])[1]);
}
8.3.3 使用button缩放
为了避免有一些人不知道双击,拖拽以及鼠标滚轮这些交互方式,生成button进行缩放
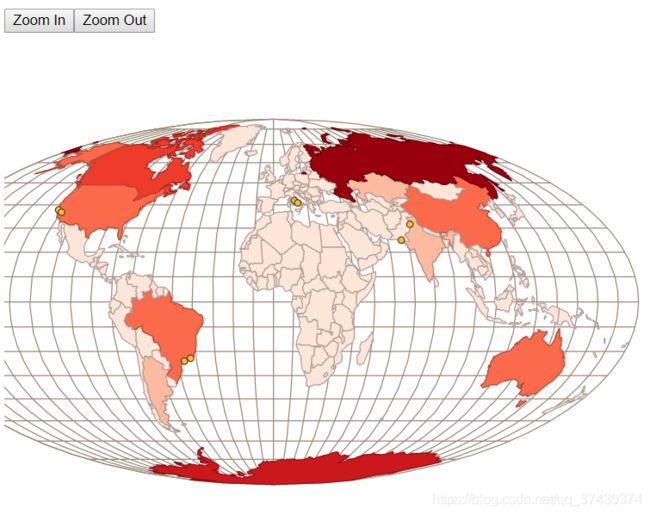
function zoomButton(zoomDirection) {
  var width = 500;
  var height = 500;
  //需要计算x,y以及中心
  if (zoomDirection == "in") {
    var newZoom = projection.scale() * 1.5;
    var newX = ((projection.translate()[0] - (width / 2)) * 1.5) + width / 2;
    var newY = ((projection.translate()[1] - (height / 2)) * 1.5) + height / 2;
  }
  else if (zoomDirection == "out") {
    var newZoom = projection.scale() * .75;
    var newX = ((projection.translate()[0] - (width / 2)) * .75) + width / 2;
    var newY = ((projection.translate()[1] - (height / 2)) * .75) + height / 2;
  }

  var newZoomSettings = d3.zoomIdentity
    .translate(newX, newY)
    .scale(newZoom);

  d3.select("svg").transition().duration(500).call(mapZoom.transform, newZoomSettings);

}

d3.select("#controls").append("button")
    .on("click", () => { zoomButton("in")}).html("Zoom In");
d3.select("#controls").append("button")
    .on("click", () => { zoomButton("out")}).html("Zoom Out");
8.4 高级的地图 Advanced mapping
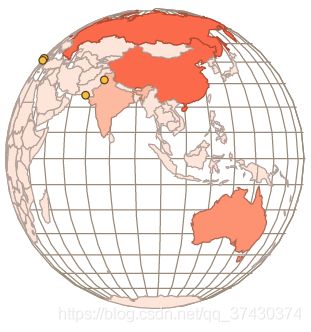
8.4.1 创建和旋转地球仪 Creating and rotating globes
不需要太麻烦,使用一个特殊的投影即可:orthographic projection
var projection = d3.geoOrthographic()
  .scale(200)
  .translate([250, 250])
  .center([0,0]);
为了使他可以旋转起来,则需要隐藏那些不在当前视图的点
d3.selectAll("circle.cities")
    .each(function (d, i) {
      var projectedPoint = projection([d.x,d.y]);
      var x = parseInt(d.x);
      var display = x + currentRotate < 90 && x + currentRotate > -90
        || (x + currentRotate < -270 && x + currentRotate > -450)
        || (x + currentRotate > 270 && x + currentRotate < 450)
        ? "block" : "none";
      d3.select(this)
          .attr("cx", projectedPoint[0])
          .attr("cy", projectedPoint[1])
          .style("display", display);
})问题:在这里使用的featureSize的大小是根据显示在地球仪上的大小(但是真实世界不会因为地球仪的旋转,面积而发生变化)
var geoPath = d3.geoPath().projection(projection);
var featureSize = d3.extent(countries.features, d => geoPath.area(d));
var countryColor = d3.scaleQuantize()
.domain(featureSize).range(colorbrewer.Reds[7]);解决方法:使用d3.geoArea(),countries coloured by their geographic area, rather than their graphical area.
var realFeatureSize = d3.extent(countries.features, d => d3.geoArea(d));
var newFeatureColor = d3.scaleQuantize()
  .domain(realFeatureSize)
  .range(colorbrewer.Reds[7]);
更复杂巧妙的拖拽,可以查看bl.ocks.org
8.4.2 卫星投影 Satellite projection
样例地址:http://bl.ocks.org/emeeks/10173187
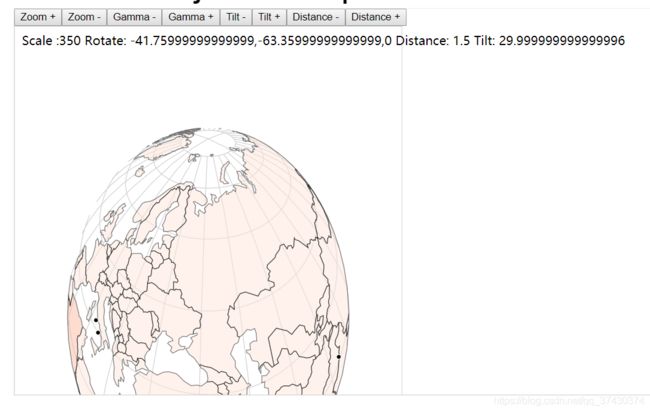
Tilt is the angle of the perspective on the data, whereas distance is the percentage of the radius of the earth.
8.5 TopoJSON data and functionality
github地址:TopoJSON
在使用TopoJSON之前,需要包含TopoJSON.js库。
8.5.1 加载数据 Loading data
var PromiseWrapper = (xhr, d) => new Promise(resolve => xhr(d, (p) => resolve(p)));
Promise
  .all([
    PromiseWrapper(d3.json, "../data/world.topojson"),
    PromiseWrapper(d3.csv, "../data/cities.csv")
  ])
  .then(resolve => {
    createMap(resolve[0], resolve[1]);
  });
function createMap(topoCountries) {
  var countries =
    topojson.feature(topoCountries, topoCountries.objects.countries);
}
8.5.2 合并 Merging
可以合并边界线

mergeAt(0);
//这里的0表示 小于或者大于 0°精度和维度
function mergeAt(mergePoint) {
  var filteredCountries = topoCountries.objects.countries.geometries
    .filter(d => {
      var thisCenter = d3.geoCentroid(
        topojson.feature(topoCountries, d) );
      return thisCenter[1] > mergePoint? true : null;
    });

  d3.select("svg").append("g")
      .datum(topojson.merge(topoCountries, filteredCountries))
      .insert("path")
      .attr("class", "merged")
      .attr("d", geoPath);
}
Topojson提供了另一个函数:Topojson.mergeArcs,可以让你合并形状,并且保持返回值依旧为TopoJSON格式。
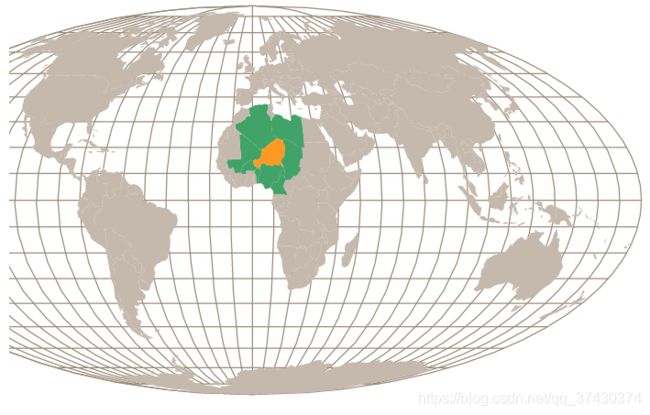
8.5.3 共享边界线的邻居 Neighbors
函数 Topojson.neighbors返回共享边界的所有features的数组
var neighbors =
  topojson.neighbors(topoCountries.objects.countries.geometries);
// 每块根据i有一个编号
d3.selectAll("path.countries")
    .on("mouseover", findNeighbors)
    .on("mouseout", clearNeighbors);

function findNeighbors (d,i) {
  d3.select(this).style("fill", "#FE9922");
  d3.selectAll("path.countries")
    .filter((p,q) => neighbors[i].indexOf(q) > -1).style("fill", "#41A368");
}
//p表示d,q表示i
function clearNeighbors () {
  d3.selectAll("path.countries").style("fill", "#C4B9AC");
}
8.6 其他
Tile-based maps:https://docs.mapbox.com/mapbox-gl-js/api/
The tile data used in tile maps:https://observablehq.com/@d3/satellite
Hexbins:https://observablehq.com/@d3/hexbin-map
使用d3.geom.voronoi函数 从类似的点导出多边形:https://www.jasondavies.com/maps/voronoi/us-capitals/
Cartograms:比较统计地图:
https://www.jasondavies.com/maps/dorling-world/
https://bl.ocks.org/mbostock/4055908
Geomapping
给地图提供上下左右的方向键,按相应的键,地图往哪边移;
但是实际上,地图的移动方向是正好与键的方向相反,点右键,地图的起始点(x,y)得向左上走;
1.drag
如果有zooming(x, y, k),drag就可以省去了,因为zooming包含了drag.
2.zooming
//Define what to do when panning or zooming
var zooming = function(d) {

	//Log out d3.event.transform, so you can see all the goodies inside
	//console.log(d3.event.transform);

	//New offset array
	var offset = [d3.event.transform.x, d3.event.transform.y];

	//Calculate new scale
	var newScale = d3.event.transform.k * 2000;

	//Update projection with new offset and scale
	projection.translate(offset)
			  .scale(newScale);

	//Update all paths and circles
	svg.selectAll("path")
		.attr("d", path);

	svg.selectAll("circle")
		.attr("cx", function(d) {
			return projection([d.lon, d.lat])[0];
		})
		.attr("cy", function(d) {
			return projection([d.lon, d.lat])[1];
		});

}

//Then define the zoom behavior
var zoom = d3.zoom()
			 .on("zoom", zooming);

//The center of the country, roughly
var center = projection([-97.0, 39.0]);

//Create a container in which all zoom-able elements will live
var map = svg.append("g")
			.attr("id", "map")
			.call(zoom)  //Bind the zoom behavior
			.call(zoom.transform, d3.zoomIdentity  //Then apply the initial transform
				.translate(w/2, h/2)
				.scale(0.25)
				.translate(-center[0], -center[1]));
3.drag需经过zooming
d3.selectAll(".pan")
	.on("click", function() {

		//Set how much to move on each click
		var moveAmount = 50;

		//Set x/y to zero for now
		var x = 0;
		var y = 0;

		//Which way are we headed?
		var direction = d3.select(this).attr("id");

		//Modify the offset, depending on the direction
		switch (direction) {
			case "north":
				y += moveAmount;  //Increase y offset
				break;
			case "south":
				y -= moveAmount;  //Decrease y offset
				break;
			case "west":
				x += moveAmount;  //Increase x offset
				break;
			case "east":
				x -= moveAmount;  //Decrease x offset
				break;
			default:
				break;
		}

		//This triggers a zoom event, translating by x, y
		map.transition()
			.call(zoom.translateBy, x, y);

	});
制作地图过程:
1. Find shapefiles
2. Choose a resolution
3. Simplify the shape
4. Convert to GeoJSON
5. Choose a projection