吴恩达机器学习课程-作业7-K-means聚类和主成分分析(python实现)
Machine Learning(Andrew) ex7-K-means Clustering and Principal Component Analysis
椰汁笔记
K-means Clustering
前面学习的内容都是监督学习,这将是我们学习的第一个非监督学习算法。
我们先把这个算法说清楚再说作业。
- 这个算法是干什么的?
将没有标签的数据,划分成K组。通过这个算法我们可以将数据进行分类,具体可以应用到根据用户数据将用户进行分类,对各类用户提供更加精细的服务等。 - 这个算法是大概是怎么做的?
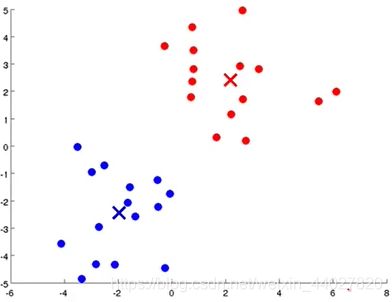
这里一起宏观地理解一下这个算法。举个例子我们需要将下面地数据进行聚类,我很可以很轻松地看出数据大致可以分为两类,左下角和右上角。
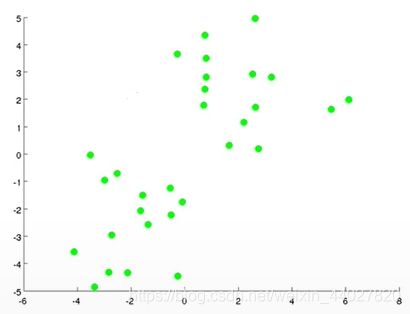
K-means算法怎么运行将这组数据分为两类呢?首先目标很明确需要分为两类,因此K=2。先选择2个聚类簇中心,这个可以随便选。
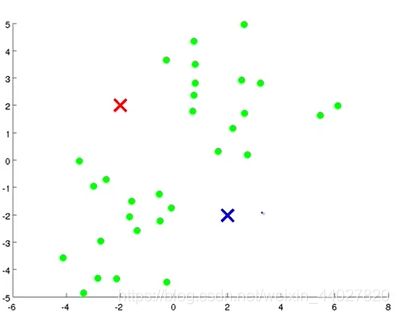
1.接着我们根据数据点距离红色簇中心还是蓝色簇中心更近,将点分为两簇。这里使用欧氏距离表示远近。
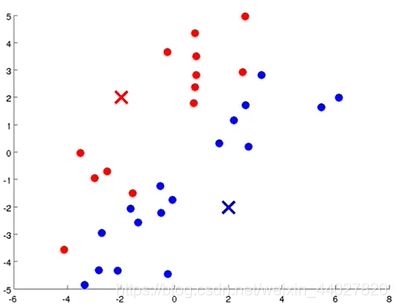
2.接着我们对于每一个簇,重新计算一个簇中心,这个中心就是这个簇所有点地平均位置。
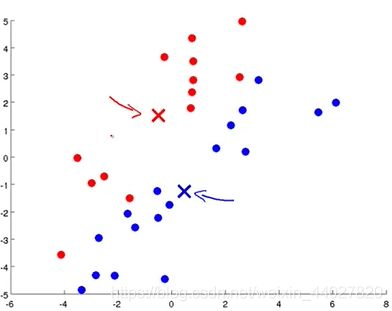
接着以这两个簇中心,重新将数据进行分类,也就是重复1步骤,接着再重复2步骤。这样不断迭代,当簇中心不再移动的时候,根据此时簇中心的分类结果就是最后的聚类结果。
- 这个算法的细节什么样的?
首先这个算法的优化目标是所有的点离其所属簇中心点的距离最小
J ( x ( 1 ) , … , x ( m ) , μ 1 , … , μ K ) = 1 m ∑ i = 1 m ( x ( i ) − μ x ( i ) ) J(x^{(1)},\dots,x^{(m)},\mu_1,\dots,\mu_K)=\frac{1}{m}\sum_{i=1}^{m}(x^{(i)}-\mu_{x^{(i)}}) J(x(1),…,x(m),μ1,…,μK)=m1i=1∑m(x(i)−μx(i))
算法描述
I n p u t : K , { x ( 1 ) , x ( 2 ) , … , x ( m ) } Randomly initialize K cluster centroids μ 1 , μ 2 , … , μ K Repeate{ x ( i ) = index (from 1 to K) of cluster centroids closest to x ( i ) , ( f o r i = 1 t o m ) μ k = average of points assigned to cluster k , ( f o r k = 1 t o K ) } Input:K,\{x^{(1)},x^{(2)},\dots,x^{(m)}\} \\\textrm{Randomly initialize K cluster centroids }\mu_1,\mu_2,\dots,\mu_K \\\textrm{Repeate\{} \\x^{(i)}=\textrm{index (from 1 to K) of cluster centroids closest to }x^{(i)},(for\ i=1\ to\ m) \\\mu_k=\textrm{average of points assigned to cluster k},(for\ k=1\ to\ K) \\\} Input:K,{ x(1),x(2),…,x(m)}Randomly initialize K cluster centroids μ1,μ2,…,μKRepeate{ x(i)=index (from 1 to K) of cluster centroids closest to x(i),(for i=1 to m)μk=average of points assigned to cluster k,(for k=1 to K)} - 如何随机初始化簇中心点呢?
可以直接在数据中直接选择点作为簇中心点。但是这里可能会因为初始化的不同,导致优化到局部最优。为了避免局部最优,我们可以通过多次不同的随机初始化,来识别局部最优解。 - 聚类的数量K怎么确定?
首先可以通过观察数据集,来直观判断,但是只适用与一维和二维的数据。另外一个可能可行的办法是ELBOW method
通过尝试不同的K值,画出最后算法收敛时的损失值与K的函数图像,若存在一个像肘部一样的突变点,即可作为K值。
但是可能画出的曲线会很平滑,因此这个算法有时不太适用。
下面就开始作业吧
- 1.1 Implementing K-means
首先需要实现,为每个点找到最近的簇中心,作为当前点的标签
c ( i ) = j that minimizes ∣ ∣ x ( i ) − μ j ∣ ∣ 2 c^{(i)}=j\textrm{ that minimizes }||x^{(i)}-\mu_j||^2 c(i)=j that minimizes ∣∣x(i)−μj∣∣2
def find_closet_centroids(X, centroids):
    """
    寻找所属簇
    :param X: ndarray,所有点
    :param centroids: ndarray,上一步计算出或初始化的簇中心
    :return: ndarray,每个点所属于的簇
    """
    res = np.zeros((1,))
    for x in X:
        res = np.append(res, np.argmin(np.sqrt(np.sum((centroids - x) ** 2, axis=1))))
    return res[1:]
测试一下
    data = sio.loadmat("data\\ex7data2.mat")
    X = data['X']  # (300,2)
    init_centroids = np.array([[3, 3], [6, 2], [8, 5]])
    idx = find_closet_centroids(X, init_centroids)
    print(idx[0:3]) # [0. 2. 1.]
接着实现第二个部分,重新计算簇中心
μ k = 1 C k ∑ i ∈ C k x ( i ) \mu_k=\frac{1}{C_k}\sum_{i\in C_k}x^{(i)} μk=Ck1i∈Ck∑x(i)
def compute_centroids(X, idx):
    """
    计算新的簇中心
    :param X: ndarray,所有点
    :param idx: ndarray,每个点对应的簇号
    :return: ndarray,所有新簇中心
    """
    K = int(np.max(idx)) + 1
    m = X.shape[0]
    n = X.shape[-1]
    centroids = np.zeros((K, n))
    counts = np.zeros((K, n))
    for i in range(m):
        centroids[int(idx[i])] += X[i]
        counts[int(idx[i])] += 1
    centroids = centroids / counts
    return centroids
继续使用上个例子测试
	print(compute_centroids(X, idx))
	# [[2.42830111 3.15792418]
 	#  [5.81350331 2.63365645]
 	#  [7.11938687 3.6166844 ]]
将这两步封装成一个完整的K-means算法,这里用到的随机初始化簇中心,在1.3实现,我直接先用一下,具体的函数看1.3。而且算法的迭代轮数可以指定一个很大的轮数保证计算完后算法收敛。我选择每次计算当前的目标值,当目标值不变时,算法收敛退出。
需要先实现损失函数
def cost(X, idx, centrodis):
    c = 0
    for i in range(len(X)):
        c += np.sum((X[i] - centrodis[int(idx[i])]) ** 2)
    c /= len(X)
    return c
def k_means(X, K):
    """
    k-means聚类算法
    :param X: ndarray,所有的数据
    :param K: int,聚类的类数
    :return: tuple,(idx, centroids_all)
                idx,ndarray为每个数据所属类标签
                centroids_all,[ndarray,...]计算过程中每轮的簇中心
    """
    centroids = random_initialization(X, K)
    centroids_all = [centroids]
    idx = np.zeros((1,))
    last_c = -1
    now_c = -2
    # iterations = 200
    # for i in range(iterations):
    while now_c != last_c:  # 当收敛时结束算法,或者可以利用指定迭代轮数
        idx = find_closet_centroids(X, centroids)
        last_c = now_c
        now_c = cost(X, idx, centroids)
        centroids = compute_centroids(X, idx)
        centroids_all.append(centroids)
    return idx, centroids_all
- 1.2 K-means on example dataset
对数据集进行聚类
    data = sio.loadmat("data\\ex7data2.mat")
    X = data['X']  # (300,2)
    idx, centroids_all = k_means(X, 3)
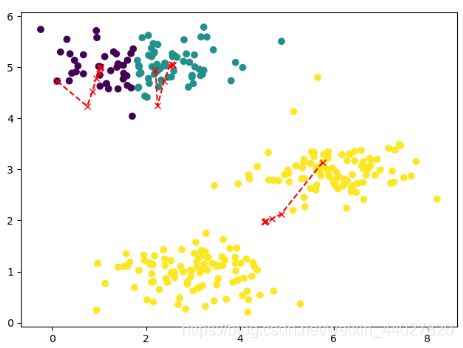
这里的聚类算中返回了每轮计算的簇中心,就是为了后面的可视化簇中心变化过程,画出聚类结果和簇中心的移动路线
def visualizing(X, idx, centroids_all):
    """
    可视化聚类结果和簇中心的移动过程
    :param X: ndarray,所有的数据
    :param idx: ndarray,每个数据所属类标签
    :param centroids_all: [ndarray,...]计算过程中每轮的簇中心
    :return: None
    """
    plt.scatter(X[..., 0], X[..., 1], c=idx)
    xx = []
    yy = []
    for c in centroids_all:
        xx.append(c[..., 0])
        yy.append(c[..., 1])
    plt.plot(xx, yy, 'rx--')
    plt.show()
看一看结果
visualizing(X, idx, centroids_all)
- 1.3 Random initialization
一般簇中心的初始化是从数据中随机选择K组
def random_initialization(X, K):
    """
    随机选择K组数据,作为簇中心
    :param X: ndarray,所有点
    :param K: int,聚类的类数
    :return: ndarray,簇中心
    """
    res = np.zeros((1, X.shape[-1]))
    m = X.shape[0]
    rl = []
    while True:
        index = random.randint(0, m)
        if index not in rl:
            rl.append(index)
        if len(rl) >= K:
            break
    for index in rl:
        res = np.concatenate((res, X[index].reshape(1, -1)), axis=0)
    return res[1:]
- 1.4 Image compression with K-means
接下来将聚类算法用于图片压缩上,先讲一讲思路
图片都是由若干像素点构成的,每个像素点都有颜色,这个颜色一般是RGB编码,意思是所有颜色都可以通过Red,Green,Blue来表示,RGB编码下三种颜色每个通过一个8比特的整数来表示强度,因此一个像素点需要24bit来表示颜色。
图片上的每个像素点都需要使用24bit存储颜色,我们的压缩方法是,通过聚类将图片上的颜色分为16种,我们只存储这十六种颜色,每个像素点上只需要4比特存储对应颜色的序号,即可达到有损压缩图片的目的。
首先引入需要的聚类算法实现,这里单独创建了一个文件
import ex7_K_means_Clustering_and_PCA.k_means_clustering as k_means
进行图片压缩,将rgb颜色作为聚类的点数据,每个颜色的表示是一个列表包含三个数。这里聚类结束后构造新的图片矩阵,不是很规范,应该是直接存储bit。
def compress(image, colors_num):
    """
    压缩图片
    :param image: ndarray,原始图片
    :param colors_num: int,压缩后的颜色数量
    :return: (ndarray,ndarray),第一个每个像素点存储一个值,第二个为颜色矩阵
    """
    d1, d2, _ = image.shape
    raw_image = image.reshape(d1 * d2, -1)  # 展开成二维数组
    idx, centroids_all = k_means.k_means(raw_image, colors_num)
    colors = centroids_all[-1]
    compressed_image = np.zeros((1, 1))  # 构造压缩后的图片格式
    for i in range(d1 * d2):
        compressed_image = np.concatenate((compressed_image, idx[i].reshape(1, -1)), axis=0)
    compressed_image = compressed_image[1:].reshape(d1, d2, -1)
    return compressed_image, colors
为了可视化效果,还需要将压缩后的图片格式转化为可以显示的标准格式
def compressed_format_to_normal_format(compressed_image, colors):
    """
    将压缩后的图片转为正常可以显示的图片格式
    :param compressed_image: ndarray,压缩后的图片,存储颜色序号
    :param colors: ndarray,颜色列表
    :return: ndarray,正常的rgb格式图片
    """
    d1, d2, _ = compressed_image.shape
    normal_format_image = np.zeros((1, len(colors[0])))
    compressed_image = compressed_image.reshape(d1 * d2, -1)
    for i in range(d1 * d2):
        normal_format_image = np.concatenate((normal_format_image, colors[int(compressed_image[i][0])].reshape(1, -1)),
                                             axis=0)
    normal_format_image = normal_format_image[1:].reshape(d1, d2, -1)
    return normal_format_image
看一看效果
    image = plt.imread("data\\bird_small.png")  # (128,128,3)
    plt.subplot(1, 2, 1)
    plt.imshow(image)
    plt.axis('off')
    plt.title("raw image")
    plt.subplot(1, 2, 2)
    compressed_image, colors = compress(image, 16)
    print(compressed_image.shape, colors.shape)
    plt.imshow(compressed_format_to_normal_format(compressed_image, colors))
    plt.axis('off')
    plt.title("compressed image")
    plt.show()
Principal Component Analysis
这部分我觉得是这个课程里面比较难理解的一部分,说实话我的这部分我也理解地不是很好。
- 主成分分析法是干什么用的?
数据降维,话句话说就是将数据地特征数量变少,但又不是简单地删除特征。数据降维地目的可以是压缩数据,减少数据的存储空间,让算法提速;也可以是将数据降到二维或者三维进行可视化 - 主成分分析法在做什么?
上面说到主成分分析法用于数据降维,大概理解一下它怎么做的。现在我们数据维度为n,我想通过降维让数据变成k维。
那么PCA做的就是对于n维空间的数据,寻找一个K维的“面”,让这些数据到这个“面”的距离最短,这个距离又叫做投影误差。
找到这个“面”后,将n维空间的点投影到这个“面”,因此所有点都投影到了k维空间,因此可以特征数量变为了k。
假设n=2,k=1,那么就是将二维平面上的点投影到一个向量上。假设n=3,k=2,那么就是将三维空间的点投影到一个平面上。 - 主成分分析法具体怎么做呢?
对于数据要从n维降到k维
首先对数据进行feature scaling/mean normalization,也就是归一化
其次计算协方差矩阵
Σ = 1 m X T X \Sigma=\frac{1}{m}X^TX Σ=m1XTX
接着计算sigma矩阵的“特征向量”,这里使用奇异值分解(single value decomposition)。
[ U , S , V ] = s v d ( Σ ) [U,S,V]=svd(\Sigma) [U,S,V]=svd(Σ)
利用U计算新的特征,若要下降到K维,取U的前K列构成新矩阵
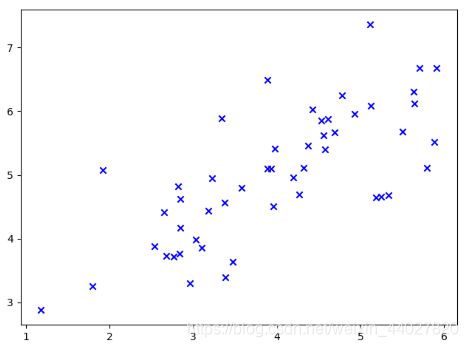
Z = U r e d u c e T X Z=U_{reduce}^TX Z=UreduceTX - 2.1 Example Dataset
    data = sio.loadmat("data\\ex7data1.mat")
    X = data['X']  # (50,2)
    plt.scatter(X[..., 0], X[..., 1], marker='x', c='b')
    plt.show()
- 2.2 Implementing PCA
实现PCA首先要做的就是对数据的处理进行归一化,注意这里的方差的计算,默认ddof为0,通常情况下是使用ddof=1,就是方差计算中最后除以m还是m-1的不同。
def data_preprocess(X):
    """
    数据归一化
    :param X: ndarray,原始数据
    :return: (ndarray.ndarray,ndarray),处理后的数据,每个特征均值,每个特征方差
    """
    mean = np.mean(X, axis=0)
    std = np.std(X, axis=0, ddof=1)  # 默认ddof=0, 这里一定要修改
    return (X - mean) / std, mean, std
numpy中有奇异值分解的功能,直接使用
def pca(X):
    sigma = X.T.dot(X) / len(X)  # (n,m)x(m,n) (n,n)
    u, s, v = np.linalg.svd(sigma)  # u(n,n) s(n,), v(n,n)
    return u, s, v
- 2.3 Dimensionality Reduction with PCA
使用PCA进行降维
def project_data(X, U, K):
    """
    数据降维
    :param X: ndarray,原始数据
    :param U: ndarray,奇异值分解后的U
    :param K: int,目标维度
    :return: ndarray,降维后的数据
    """
    return X.dot(U[..., :K])
逆向思维,还可以进行降维后的升维
def reconstruct_data(Z, U, K):
    """
    数据升维
    :param Z: ndarray,降维后的数据
    :param U: ndarray,奇异值分解后的U
    :param K: int,降维的维度
    :return: ndarray,原始数据
    """
    return Z.dot(U[..., :K].T)
测试一下
    data = sio.loadmat("data\\ex7data1.mat")
    X = data['X']  # (50,2)
    normalized_X, _, _ = data_preprocess(X)
    u, _, _ = pca(normalized_X)  # (2,2)
    Z = project_data(normalized_X, u, 1)
    print(Z[0]) # [1.48127391]
    rec_X = reconstruct_data(Z, u, 1)
    print(rec_X[0]) # [-1.04741883 -1.04741883]
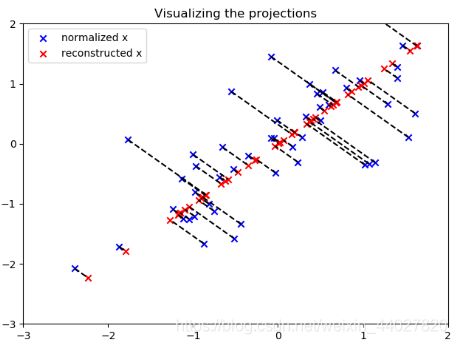
将这个投影可视化
    plt.scatter(normalized_X[..., 0], normalized_X[..., 1], marker='x', c='b', label='normalized x')
    plt.scatter(rec_X[..., 0], rec_X[..., 1], marker='x', c='r', label='reconstructed x')
    plt.title("Visualizing the projections")
    for i in range(len(normalized_X)):
        plt.plot([normalized_X[i][0], rec_X[i][0]], [normalized_X[i][1], rec_X[i][1]], 'k--')
    plt.xlim((-3, 2))
    plt.ylim((-3, 2))
    plt.legend()
    plt.show()
- 2.4 Face Image Dataset
将PCA应用到人类数据集上,当前的每张人脸图片为1024像素,因此为1024维。我们的目标是将数据降维到36像素,也就是36维。
这里单独创建一个文件,先引入实现好的PCA
import ex7_K_means_Clustering_and_PCA.PCA as pca
使用PCA进行降维
    data = sio.loadmat("data\\ex7faces.mat")
    X = data['X']  # (5000,1024)
    nor_X, _, _ = pca.data_preprocess(X)
    u, _, _ = pca.pca(nor_X)
    Z = pca.project_data(nor_X, u, 36)
    rec_X = pca.reconstruct_data(Z, u, 36)
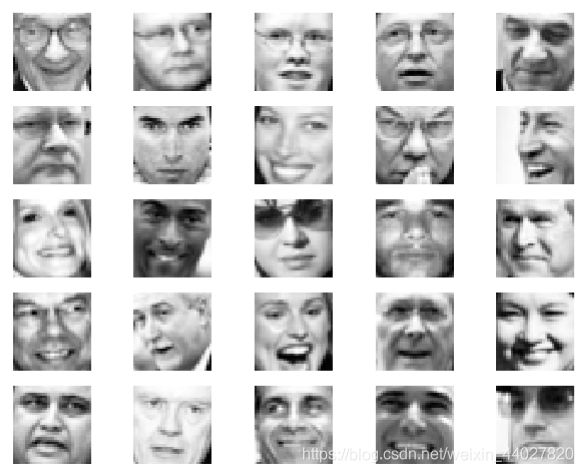
将前后的图片可视化对比一下,记得要想人脸位置为正向需要转置一下
def visualizing_images(X, d):
    """
    可视化图片
    :param X: ndarray,图片
    :param d: int,一行展示多少张图片
    :return: None
    """
    m = len(X)
    n = X.shape[-1]
    s = int(np.sqrt(n))
    for i in range(1, m + 1):
        plt.subplot(m / d, d, i)
        plt.axis('off')
        plt.imshow(X[i - 1].reshape(s, s).T, cmap='Greys_r')  # 要把脸摆正需要转置
    plt.show()
    visualizing_images(X[:25], 5)
    visualizing_images(rec_X[:25], 5)
总结
- K的选择
1 m ∑ i = 1 m ∣ ∣ x ( i ) − x a p p r o x ( i ) ∣ ∣ 2 1 m ∑ i = 1 m ∣ ∣ x ( i ) ∣ ∣ 2 ≤ 0.01 \frac{\frac{1}{m}\sum_{i=1}^m||x^{(i)}-x^{(i)}_{approx}||^2}{\frac{1}{m}\sum_{i=1}^m||x^{(i)}||^2}\le0.01 m1∑i=1m∣∣x(i)∣∣2m1∑i=1m∣∣x(i)−xapprox(i)∣∣2≤0.01
选择K使上面的值尽可能小,一般是小于0.01。
这个公式的上面部分是平均平方投影误差,下面部分是平均数据方差。这个比值的意思是降维损失值。0.01可以理解为99%的方差被保留。 - PCA可以对监督学习算法进行加速
- PCA不推荐用于解决过拟合问题,因为它没有考虑y,会忽略一些信息。过拟合问题还是使用正则化解决。
完整的代码会同步 在我的github
欢迎指正错误

