MATLAB学习笔记(一):绘制二维箭头图
MATLAB学习笔记(一):绘制二维箭头图
- MATLAB矢量图绘制
-
- 1 quiver函数
- 2 应用:绘制某一曲线的切向量和法向量
- MATLAB罗盘图绘制
-
- 1 compass函数
- 2 应用:绘制相量图
- MATLAB注解图绘制
-
- 1 annotation函数
- 2 例子(来源于帮助文档)
MATLAB矢量图绘制
1 quiver函数
quiver(x,y,u,v)
使用 quiver 在 x 和 y 的每个数据点处显示箭头,这样箭头方向和长度分别由 u 和 v 中的相应值表示。
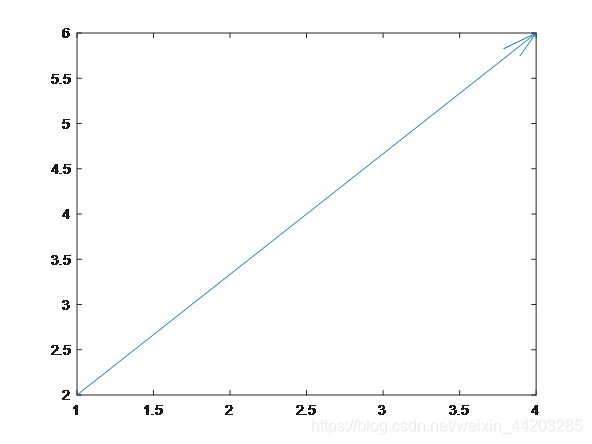
>> quiver(1,2,3,4) %箭头起点为坐标(1,2),倾角就是atan(4/3),模长为sqrt(3^2+4^2)

由图中可以知道长度达不到,是因为函数默认将向量scale到相应的尺度的模长倍数不为1,通过以下命令改变倍数:
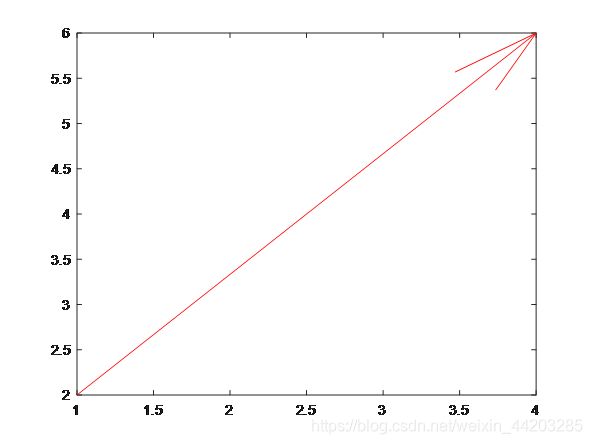
>> quiver(1,2,3,4,1)
>> quiver(1,2,3,4,1,'MaxHeadSize',0.5,'color','r')
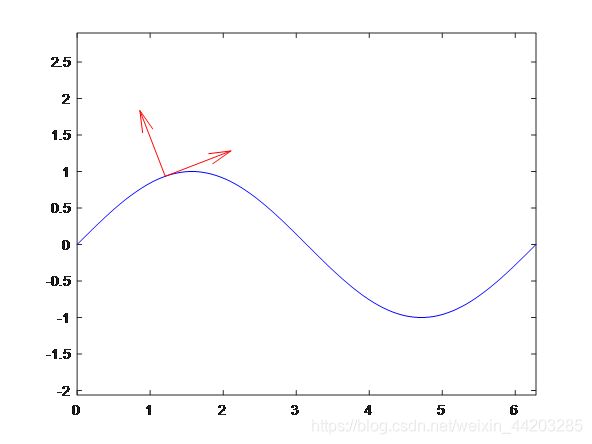
2 应用:绘制某一曲线的切向量和法向量
clear,clc
close all
x=linspace(0,2*pi,100);
y=sin(x);
% 数值求导
y1=[0,diff(y)./diff(x)];
figure
plot(x,y,'b-');hold on     % 画曲线
quiver(x(20),y(20),1,y1(20),'r','MaxHeadSize',1);   % 画切矢量
quiver(x(20),y(20),-y1(20),1,'r','MaxHeadSize',1);  % 画法矢量
axis equal
MATLAB罗盘图绘制
1 compass函数
h = compass(Z)
显示具有n个箭头的罗盘图,其中n是Z(Z为复数)中元素的数量。每个箭头的初始位置是原点,由Z的实部和虚部确定的每个箭头的尖端位置都相对于原点。此语法等效于h = compass(real(Z),imag(Z))
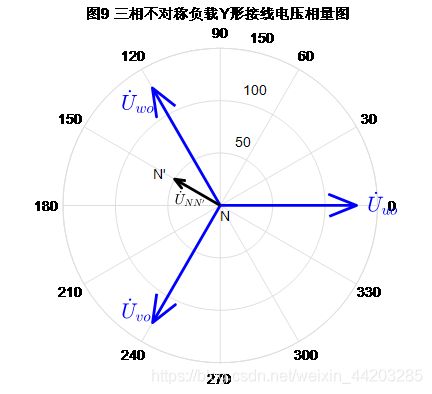
2 应用:绘制相量图
clear,clc
close all
%% 数据预处理
U1 = 225.2/sqrt(3); U2 = 223.6/sqrt(3)*exp(-1i*120*pi/180); U3 = 224.2/sqrt(3)*exp(1i*120*pi/180);
Un = 50.25*exp(1i*150*pi/180);
U1n = U1 - Un; U2n = U2 - Un; U3n = U3 - Un;
%% 可视化
ha1 = compass([U1,U2,U3]);%绘制相量图
set(ha1,'linewidth',2,'color','b');%加粗相量图的线条
hold on;
ha2 = compass([Un]);%绘制相量图
set(ha2,'linewidth',2,'color','k');%加粗相量图的线条
text(real(U1)+10,imag(U1), '$\dot U_{uo} $','color','b','interpreter','latex','fontsize',15);
text(real(U2)-30,imag(U2)+10, '$\dot U_{vo} $','color','b','interpreter','latex','fontsize',15);
text(real(U3)-30,imag(U3)-15, '$\dot U_{wo} $','color','b','interpreter','latex','fontsize',15);
text(real(Un),imag(Un)-20, '$\dot U_{NN''} $','color','k','interpreter','latex');
text(0,-10, 'N','color','k');
text(real(Un)-20,imag(Un)+5, 'N''','color','k');
title('图9 三相不对称负载Y形接线电压相量图')
MATLAB注解图绘制
1 annotation函数
- annotation(lineType,x,y)
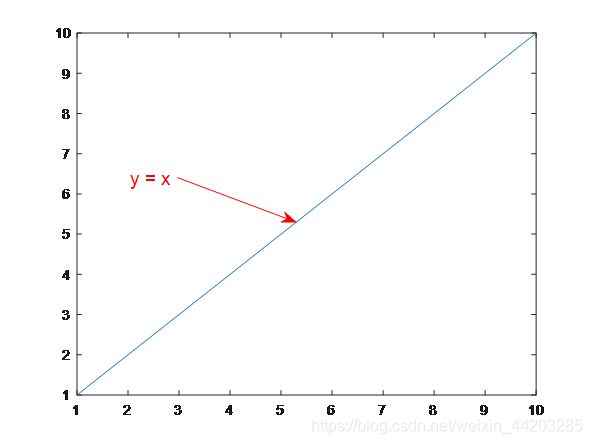
创建在当前图形的两个点之间延伸的线或箭头注释。 将lineType指定为line, arrow, doublearrow或 textarrow。 将x和y分别指定为[x_begin x_end]和[y_begin y_end]形式的两个元素向量,其中x、y表示经图形窗口归一化后数值,其范围在0~1之间。 - annotation(shapeType,dim)
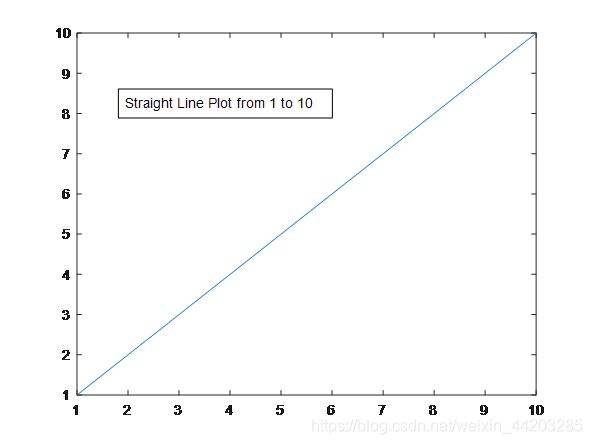
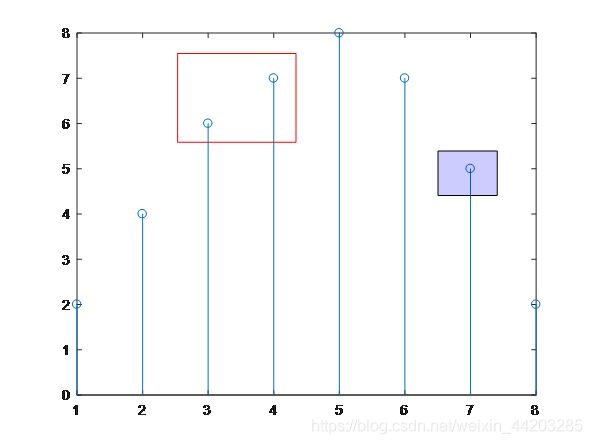
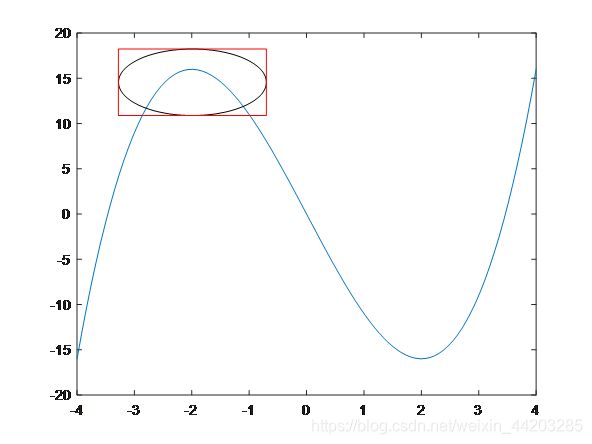
将在当前图形中创建具有特定大小和位置的矩形,椭圆形或文本框注解。将shapeType指定为rectangle,ellipse或textbox。将dim指定为格式为[x y w h]的四元素向量。 x和y元素确定位置,w和h元素确定大小。
2 例子(来源于帮助文档)
clear,clc
close all
figure
plot(1:10)
x = [0.3 0.5];
y = [0.6 0.5];
a = annotation('textarrow',x,y,'String','y = x ');
a.Color = 'red';
a.FontSize = 14;

figure
plot(1:10)
dim = [.2 .5 .3 .3];
str = 'Straight Line Plot from 1 to 10';
annotation('textbox',dim,'String',str,'FitBoxToText','on');  % FitBoxToText:强制框紧密适合文本

figure
data = [2 4 6 7 8 7 5 2];
stem(data)
dim = [.3 .68 .2 .2];
annotation('rectangle',dim,'Color','red')
dim2 = [.74 .56 .1 .1];
annotation('rectangle',dim2,'FaceColor','blue','FaceAlpha',.2)   % FaceAlpha:颜色深度

figure
x = linspace(-4,4);
y = x.^3 - 12*x;
plot(x,y)
dim = [.2 .74 .25 .15];
annotation('ellipse',dim)
annotation('rectangle',dim,'Color','red')
