python3对多个CSV文件数据进行筛选分类绘图
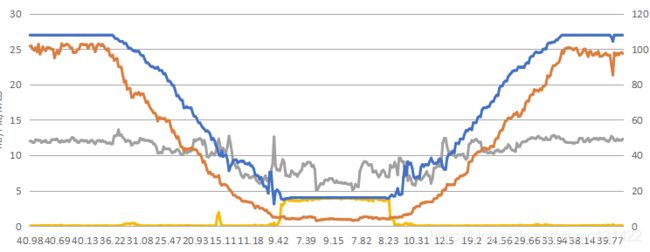
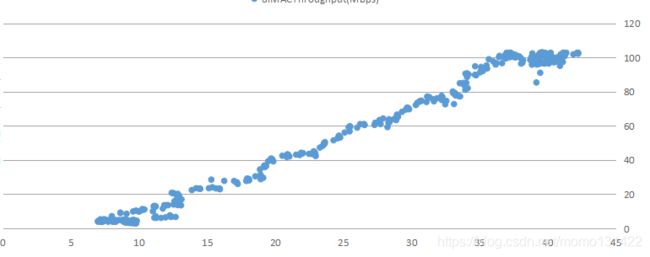
功能:导入多个csv文件组成的zip压缩包,每个csv文件都有一列id,根据id进行筛选,将不同csv文件中相同id的指定列进行筛选然后合并到一个xls文件当中,不同的终端数据合并到不同的sheet下,并根据不同要求进行绘制折线图或散点图。
from zipfile import ZipFile
import os
import pandas as pd
import numpy as np
from xlsxwriter import Workbook
from datetime import datetime
from logg import logger
import re
import time
def UnzipFile(file_path):
if file_path.endswith(‘zip’):
zip_file = ZipFile(file_path) #获取压缩文件对象
new_file_path = file_path.split(’.’)[0] #获取创建文件夹名字
if os.path.isdir(new_file_path):
pass
else:
os.mkdir(new_file_path)
for name in zip_file.namelist(): # 解压文件
zip_file.extract(name, new_file_path)
zip_file.close()
logger(‘info’, ‘解压’+file_path+‘完成’)
return True
#给与一个文件夹路径,然后将其中的所有csv文件名读取,返回一个csv文件名的列表和各个csv文件的数据
def ReadCsvNameAndDataInFile(file_path, filetype):
name = []
final_name = []
a = []
data = []
di = {}
for root, dirs, files in os.walk(file_path):
for i in files:
if filetype in i:
a.append(i)
di[i] = pd.read_csv(file_path + i)
name.append(i.replace(filetype, ‘’)) # 生成不带‘.csv’后缀的文件名组成的列表
final_name = [item + ‘.csv’ for item in name] # 生成‘.csv’后缀的文件名组成的列表
data = [file_path + i for i in a]
return final_name, data, di # 输出由有‘.csv’后缀的文件名组成的列表
def ReadTxt(file_path):
try:
with open(file_path, “r”) as f: # 打开文件
data = f.read() # 读取文件
data = re.split(’=|\n| ', data)
print(len(data))
for str in data[:]:
if ‘’ == str:
data.remove(str)
return data
except:
logger(‘error’, ‘找不到’+file_path+‘配置文件!!!’)
return False
#将dataframe数据结构转换成list
def ChangeDataframeToList(data):
data_array = np.array(data)
data_list = data_array.tolist()
if len(data_list) > 0:
del(data_list[0])
return data_list
def IsNumber(s):
try:
float(s)
return True
except ValueError:
pass
try:
import unicodedata
unicodedata.numeric(s)
return True
except (TypeError, ValueError):
pass
return False
def IsValidDate(str):
‘’‘判断是否是一个有效的日期字符串’’’
try:
time.strptime(str.split(’ ')[0], “%Y-%m-%d”)
return True
except:
return False
def CreateXls(file_path):
f = Workbook(file_path)
return f
def CreateSheet(f, sheet_name):
sheet = f.add_worksheet(sheet_name)
return sheet
def WriteXls(sheet, datas, row_name, row, column):
# 将数据写入第 row 行,第 column 列
weight = 1
if ‘Rb’ in row_name:
weight = 10
row_name = row_name + ‘/’ + str(weight)
if ‘SdmaNum’ in row_name:
weight = 100
row_name = row_name + ‘/’ + str(weight)
if ‘srsSinr’ in row_name:
weight = 4
row_name = row_name + ‘/’ + str(weight)
if ‘NONE’ not in row_name:
sheet.write(0, column, row_name)
for data in datas:
if IsNumber(data):
sheet.write(row, column, float(data)/weight)
elif IsValidDate(data):
sheet.write(row, column, data)
else:
sheet.write(row, column, -255)
row = row + 1
return row
def SaveXls(f):
f.close()
def DrawLineAddChart(f):
chart_col = f.add_chart({‘type’: ‘line’})
return chart_col
def DrawLineAddSeries(chart_col, row, sheet_name, column_index, color, y2_axis_flag):
chart_col.add_series({ #
‘name’: ‘=’ + sheet_name + ‘!$’ + column_index + ‘KaTeX parse error: Expected 'EOF', got '#' at position 6: 1', #̲ 这是图例的名字 …B 2 : 2: 2:BKaTeX parse error: Expected 'EOF', got '#' at position 16: ' + str(row), #̲ 这是横轴 '…’ + column_index + ‘ 2 : 2: 2:’ + column_index + ‘$’ + str(row), # 这是值
‘line’: {‘color’: color}, # 这是颜色
‘y2_axis’: y2_axis_flag,
‘data_labels’: {‘value’: False}, # 设置曲线上不点点
})
def DrwaLineSetTitle(chart_col, chart_col_name, x_axis_name, y_axis_name, y2_axis_name):
chart_col.set_title({
‘name’: chart_col_name,
‘name_font’: {
‘color’: ‘#FF0000’,
‘size’: 14,
‘bold’: False
},
})
chart_col.set_x_axis({
‘name’: x_axis_name,
‘label_position’: ‘low’,
‘name_font’: {
‘color’: ‘#646464’,
‘bold’: False
},
‘num_font’: {
‘rotation’: 0, # 避免文字旋转
‘color’: ‘#646464’
},
‘line’: {
‘none’: True # 去掉刻度线
}
})
chart_col.set_y_axis({
‘name’: y_axis_name,
‘name_font’: {
‘color’: ‘#646464’,
‘bold’: False
},
‘num_font’: {
‘color’: ‘#646464’
},
‘line’: {
‘none’: True # 去掉刻度线
},
‘major_gridlines’: { # 设置刻度线的颜色更浅
‘visible’: True,
‘line’: {‘color’: ‘#A6A6A6’}
}
})
chart_col.set_y2_axis({
‘name’: y2_axis_name,
‘name_font’: {
‘color’: ‘#646464’,
‘bold’: False
},
‘num_font’: {
‘color’: ‘#646464’
},
‘line’: {
‘none’: True # 去掉刻度线
},
‘min’: 0
})
def DrwaLineSetStyle(sheet, chart_col, position):
chart_col.set_style(1)
chart_col.set_legend({ # 设置图例
‘position’: ‘top’,
‘font’: {
‘color’: ‘#646464’
},
})
sheet.insert_chart(position, chart_col, { # 设置位置
‘x_offset’: 0,
‘y_offset’: 0,
‘x_scale’: 1.5,
‘y_scale’: 1.5,
}) # 第一个参数为图表插入的起始位置, x_offset、y_offset为偏移量, x_scale、y_scale为缩放比率
def DrawScatter(f, sheet, row, sheet_name, position):
chart_col1 = f.add_chart({‘type’: ‘scatter’})
chart_col1.add_series({ # 画PDCP流量曲线
‘name’: ‘=’ + sheet_name + ‘!$CKaTeX parse error: Expected 'EOF', got '#' at position 6: 1', #̲ 'categ…B 2 : 2: 2:BKaTeX parse error: Expected 'EOF', got '#' at position 16: ' + str(row), #̲ 'value…C 2 : 2: 2:C$’ + str(row), #
# ‘scatter’: {‘color’: ‘#5B9BD5’},
‘marker’: {
‘type’: ‘circle’,
‘size’: 5,
‘border’: {‘color’: ‘#5B9BD5’},
‘fill’: {‘color’: ‘#5B9BD5’}
},
# ‘y2_axis’: 1, # 设置辅纵坐标
‘data_labels’: {‘value’: False},
})
chart_col1Name = '上行解调散点图'
# 设置图表的title 和 x,y轴信息
chart_col1.set_title({
    'name': chart_col1Name,
    'name_font': {
        'size': 14,
        'bold': False
    },
})
chart_col1.set_x_axis({
    'name': 'PUSCH_SINR',
    'name_font': {
        'color': '#646464',
        'bold': False
    },
    'num_font': {
        'color': '#646464'
    },
    'line': {
        'none': True  # 去掉刻度线
    }
})
chart_col1.set_y_axis({
    'name': 'Ul_Pdcp_Tput(mbps)',
    'name_font': {
        'color': '#646464',
        'bold': False
    },
    'num_font': {
        'color': '#646464'
    },
    'label_position': 'high',
    'major_gridlines': {
        'visible': True,
        'line': {'color': '#A6A6A6'}
    },
    'min': 0,
    'line': {
        'none': True  # 去掉刻度线
    }
})

chart_col1.set_legend({
    'position': 'top',
    'font': {
        'color': '#646464'
    },
})
sheet.insert_chart(position, chart_col1, {
    'x_offset': 0,
    'y_offset': 0,
    'x_scale': 1.5,
    'y_scale': 1.5,
})  # 第一个参数为图表插入的起始位置, x_offset、y_offset为偏移量, x_scale、y_scale为缩放比率
def Draw(f,sheet_list):
color_list = [’#DA7C3B’, ‘#9F9F9F’, ‘#F7BA00’, ‘#4270C2’, ‘#235C8F’, ‘#9C460C’, ‘#70AD47’, ‘#4def00’, ‘#d8bfd8’, ‘#9C460C’]
for sheet in sheet_list:
row = sheet.dim_rowmax + 1
sheet_name = sheet.name
print(sheet_name)
if ‘CELL’ in sheet.name:
chart_col_cell_1 = DrawLineAddChart(f)
chart_col_cell_2 = DrawLineAddChart(f)
DrawLineAddSeries(chart_col_cell_1, row, sheet_name, ‘B’, color_list[0], 0)
DrawLineAddSeries(chart_col_cell_2, row, sheet_name, ‘C’, color_list[1], 0)
DrwaLineSetTitle(chart_col_cell_1,sheet_name + ‘小区级上行流量曲线’,‘time’,‘ulMACThroughput(Mbps)’,’’)
DrwaLineSetTitle(chart_col_cell_2, sheet_name + ‘小区级下行流量曲线’, ‘time’, ‘dlMACThroughput(Mbps)’, ‘’)
DrwaLineSetStyle(sheet,chart_col_cell_1,‘B4’)
DrwaLineSetStyle(sheet, chart_col_cell_2, ‘N4’)
if ‘UL’ in sheet.name:
DrawScatter(f, sheet, row, sheet_name, ‘N4’)
chart_col_ul = DrawLineAddChart(f)
DrawLineAddSeries(chart_col_ul, row, sheet_name, ‘C’, color_list[0], 1)
for i in range(sheet.dim_colmax-2):
DrawLineAddSeries(chart_col_ul, row, sheet_name, chr(ord(‘C’) + i + 1), color_list[i+1], 0)
DrwaLineSetTitle(chart_col_ul, ‘UE’ + sheet_name + ‘上行流量折线图’, ‘PUSCH_SINR’, ‘RB/Pkt/MCS’, ‘ulMACThroughput(Mbps)’)
DrwaLineSetStyle(sheet, chart_col_ul, ‘B4’)
if ‘DL’ in sheet.name:
chart_col_dl = DrawLineAddChart(f)
DrawLineAddSeries(chart_col_dl, row, sheet_name, ‘C’, color_list[0], 1)
for i in range(sheet.dim_colmax - 2):
DrawLineAddSeries(chart_col_dl, row, sheet_name, chr(ord(‘C’) + i + 1), color_list[i + 1], 0)
DrwaLineSetTitle(chart_col_dl, ‘UE’ + sheet_name + ‘下行流量折线图’, ‘srsSinr’, ‘RB/Pkt/MCS/RI/transmode’, ‘dlMACThroughput(Mbps)’)
DrwaLineSetStyle(sheet, chart_col_dl, ‘B4’)
print(’’)
#输入cpfueid_list然后输出一个字典,以ueid为关键字,出现次数为值,并按从出现最多到最少进行排序
def ArrangeCpfUeIdToDic(cpfueid_list):
cpfueid_dic = {}
for i in range(len(cpfueid_list)):
if str(cpfueid_list[i]) in cpfueid_dic:
cpfueid_dic[str(cpfueid_list[i])] = cpfueid_dic[str(cpfueid_list[i])] + 1
else:
cpfueid_dic[str(cpfueid_list[i])] = 0
cpfueid_tuple = sorted(cpfueid_dic.items(), key=lambda x: x[1], reverse=True) # 按字典集合中,每一个元组的第二个元素排列。
cpfueid_dic = {}
for item in cpfueid_tuple:
cpfueid_dic[item[0]] = item[1]
return cpfueid_dic
def GetColumnDataFromCsv(csv_data_dic, csv_name, column_name):
list = []
for key in csv_data_dic:
if csv_name in key:
data = csv_data_dic[str(key)][column_name]
list = ChangeDataframeToList(data) + list
print(list)
dic = ArrangeCpfUeIdToDic(list)
return dic
def GatherMtsData(file_path_str):
file_path_list = file_path_str.split(’;\n’)[:-1] # 去掉分出来的空
now_time = datetime.now()
for file_path in file_path_list:
if UnzipFile(file_path):
for root, dirs, files in os.walk(file_path.strip(’.zip’)):
print(root) # 当前目录路径
print(dirs) # 当前路径下所有子目录
print(files) # 当前路径下所有非目录子文件
        mts_target_list = ReadTxt('MTS.ini')
        if mts_target_list == False:
            return False
        result_xls_path = root + '\\' +'汇总.xls'
        f = CreateXls(result_xls_path)
        csv_name_list, csv_path_list, csv_data_dic = ReadCsvNameAndDataInFile(root + '\\', '.csv')
        ueid_dic = GetColumnDataFromCsv(csv_data_dic, 'UE_AVG_MCS', 'CpfUeId')
        cellid_dic = GetColumnDataFromCsv(csv_data_dic, 'CELL_MAC_THROUGHPUT', 'CellId')
        if ueid_dic == {}:
            logger('error', 'MTS数据压缩包中没有UE_AVG_MCS文件')
            return False
        if cellid_dic == {}:
            logger('error', 'MTS数据压缩包中没有UE_AVG_MCS文件')
            return False
        i = 0
        for key in list(ueid_dic):
            i = i + 1
            if i >= 10:
                ueid_dic.pop(key)
        mode = ''
        cell_sheet_flag = False
        column = 0
        row = 0
        sheet_name = ''
        row_name = ''
        sheet_list = []

        for key in cellid_dic:
            for i in range(len(mts_target_list)):
                if mts_target_list[i] == 'CELL' or cell_sheet_flag:
                    cell_sheet_flag = True
                    mode = 'CELL'
                    if i % 2 == 1:
                        for j in csv_name_list:
                            if mts_target_list[i - 1] in j:
                                row_data_dataframe = csv_data_dic[j][mts_target_list[i]]
                                row_data_list = ChangeDataframeToList(row_data_dataframe)
                                print(row_data_list)
                                if sheet_name != mode:
                                    sheet_name = mode
                                    sheet = CreateSheet(f, 'CELL-'+key)
                                    sheet_list.append(sheet)
                                if len(row_data_list) > 0:
                                    if mts_target_list[i] == row_name:
                                        column = column - 1
                                        row = WriteXls(sheet, row_data_list, mts_target_list[i]+'NONE', row, column)
                                    else:
                                        row = 1
                                        row = WriteXls(sheet, row_data_list, mts_target_list[i], row, column)
                                        row_name = mts_target_list[i]
                                    column = column + 1

        mode = ''
        row = 0
        sheet_name = ''
        row_name = ''

        for key in ueid_dic:
            for i in range(len(mts_target_list)):
                if mts_target_list[i] == 'CELL':
                    break
                if 'MODE' == mts_target_list[i]:
                    mode = mts_target_list[i + 1]
                    column = 0
                    pass
                if i % 2 == 1:
                    for j in csv_name_list:
                        if mts_target_list[i - 1] in j:
                            row_data_dataframe = csv_data_dic[j][mts_target_list[i]][csv_data_dic[j]['CpfUeId'] == key]
                            row_data_list = ChangeDataframeToList(row_data_dataframe)
                            print(row_data_list)
                            if sheet_name != key + '-' + mode:
                                sheet_name = key + '-' + mode
                                sheet = CreateSheet(f, sheet_name)
                                sheet_list.append(sheet)
                            if len(row_data_list) > 0:
                                if mts_target_list[i] == row_name:
                                    column = column - 1
                                    row = WriteXls(sheet, row_data_list, mts_target_list[i]+'NONE', row, column)
                                else:
                                    row = 1
                                    row = WriteXls(sheet, row_data_list, mts_target_list[i], row, column)
                                    row_name = mts_target_list[i]
                                column = column + 1
        print(sheet.dim_rowmax)
        print(sheet.name)
        print(sheet.dim_colmax)
        Draw(f, sheet_list)
        SaveXls(f)
    logger('info', file_path + '数据分析完毕')
return True
if name == ‘main’:
file_path = “D:\work\AMC_Plot_source\test\STA-3734-10262034-20201030090203.zip”
GatherMtsData(file_path)

