K-Means聚类算法(一)
1.概述:
K-means聚类算法也称k均值聚类算法,是聚类算法的典型代表,可以说是最简单的聚类算法没有之一。它采用距离作为相似性的评价指标,即认为两个对象的距离越近,其相似度就越大。该算法认为类簇是由距离靠近的对象组成的,因此把得到紧凑且独立的簇作为最终目标。
2.算法思想:
K-means聚类算法是一种迭代求解的聚类分析算法,其步骤是随机选取K个对象作为初始的聚类中心,然后计算每个对象与各个种子聚类中心之间的距离,把每个对象分配给距离它最近的聚类中心。聚类中心以及分配给它们的对象就代表一个聚类。每分配一个样本,聚类的聚类中心会根据聚类中现有的对象被重新计算。这个过程将不断重复直到满足某个终止条件。终止条件可以是:1)没有(或最小数目)对象被重新分配给不同的聚类;2)没有(或最小数目)聚类中心再发生变化;3)误差平方和局部最小。
3.算法执行过程:
顺序 |
过程 |
| 1 | 随机抽取K个样本作为最初的质心 |
| 2 | 开始循环 |
| 2.1 | 将每个样本点分配到离他们最近的质心,生成K个簇 |
| 2.2 | 对于每个簇,计算所有被分到该簇的样本点的平均值作为新的质心 |
| 3 | 当质心的位置不在变化,迭代停止,聚类完成 |
4.模型评估指标:轮廓系数
轮廓系数是最常用的聚类算法的评价指标。它是对每个样本来定义的,它能够同时衡量:
1)样本与其自身所在的簇中的其他样本的相似度a,等于样本与同一簇中所有其它点之间的平均距离。
2)样本与其它簇中的样本的相似度b,等于样本与下一个最近的簇中的所有点之间的平均距离。
根据聚类的要求"簇内差异小,簇外差异大",我们希望b永远大于a,并且大得越多越好。
单个样本的轮廓系数计算公式为:
公式可以被解析为:
很容易理解轮廓系数范围是(-1,1)其中值越接近1表示样本与自己所在的簇中的样本很相似,并且与其它簇中的样本不相似,当样本与簇外样本更相似的时候,轮廓系数就为负。如果一个簇中的大多数样本具有比较高的轮廓系数,则簇会有比较高的总轮廓系数,则整个数据集的平均轮廓系数也高,聚类是合适的。
sklearn中,使用metrics中的类silhouette_score来计算轮廓系数,它返回所有样本轮廓系数的均值。silhouette_sample,它返回数据集中每个样本自己的轮廓系数。
还有一些其它指标,例如卡林斯基—哈拉巴斯指数,计算起来很快,这里就不详细介绍了。。。。。。
案例:基于轮廓系数选择最佳n_clusters
#导包
from sklearn.cluster import KMeans
from sklearn.metrics import silhouette_samples,silhouette_score
import matplotlib.pyplot as plt
import matplotlib.cm as cm #colormap
import numpy as np
import pandas as pd
from sklearn.datasets import make_blobs

#自己创建数据集
X,y=make_blobs(n_samples=500,n_features=2,centers=4,random_state=1)

fig,ax1=plt.subplots(1)
ax1.scatter(X[:,0],X[:,1]
            ,marker='o'#点的形状
            ,s=8)#点的大小
plt.show()


for n_clusters in [2,3,4,5,6,7]:
    n_clusters=n_clusters
    fig,(ax1,ax2)=plt.subplots(1,2)#一个画布,两个子图
    fig.set_size_inches(18,7)
    ax1.set_xlim([-0.1,1])#设置x轴取值
    ax1.set_ylim([0,X.shape[0]+(n_clusters+1)*10])#设置y轴取值

    #开始建模
    cluster=KMeans(n_clusters=n_clusters,random_state=0).fit(X)
    cluster_labels=cluster.labels_
    silhouette_avg=silhouette_score(X,cluster_labels)#所有样本轮廓系数的均值
    print('For n_clusters=',n_clusters,'The average silhouette_score is:',silhouette_avg)
    sample_silhouette_values=silhouette_samples(X,cluster_labels)
    y_lower=10#设定y轴初始取值

    #对每一个簇进行循环
    for i in range(n_clusters):
        ith_cluster_silhouette_values = sample_silhouette_values[cluster_labels == i]#每一个样本的轮廓系数
        ith_cluster_silhouette_values.sort()
        size_cluster_i = ith_cluster_silhouette_values.shape[0]#这一个簇中样本个数
        y_upper = y_lower + size_cluster_i#簇的y轴上限
        color = cm.nipy_spectral(float(i) / n_clusters)#每次循环生成不同颜色
        ax1.fill_betweenx(np.arange(y_lower, y_upper)
                        , ith_cluster_silhouette_values
                        , facecolor=color
                        , alpha=0.7
                        )
        ax1.text(-0.05, y_lower + 0.5 * size_cluster_i, str(i))#给每一簇轮廓系数显示编号
        y_lower = y_upper + 10#不同簇添加空隙

    ax1.set_title('The silhouette plot for the various clusters.')
    ax1.set_xlabel('The silhouette coefficient values')
    ax1.set_ylabel('Cluster label')
    ax1.axvline(x=silhouette_avg,color='red',linestyle='--')#画轮廓系数均值线
    ax1.set_yticks([])
    ax1.set_xticks([-0.1,0,0.2,0.4,0.6,0.8,1])
    colors=cm.nipy_spectral(cluster_labels.astype(float)/n_clusters)

    ax2.scatter(X[:,0],X[:,1]
                ,marker='o'
                ,s=8
                ,c=colors)
    centers=cluster.cluster_centers_
    ax2.scatter(centers[:,0],centers[:,1],marker='x',c='red',alpha=1,s=200)
    ax2.set_title('The visualization of the clustered data.')
    ax2.set_xlabel('Feature space for the 1st feature')
    ax2.set_ylabel('Feature space for the 2nd feature')

    plt.suptitle(("Silhouette analysis for KMeans clustering on sample data"
                  "with n_clusters=%d" % n_clusters),
                 fontsize=14,fontweight='bold')#为整个图设置标题
    plt.show()
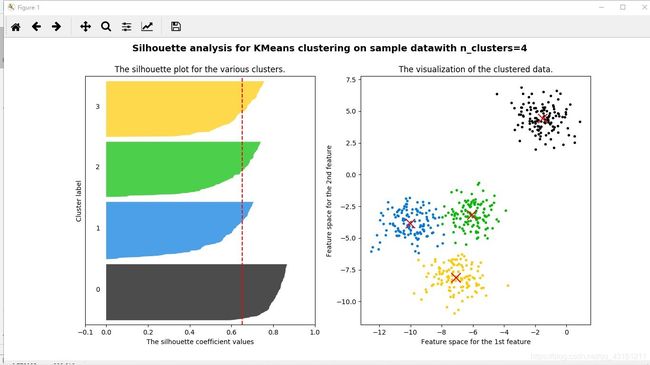
运行:这里只放了n_clusters=2,4的,到底选哪簇,具体选择就得看你的业务需求了。


