按:RNA-seq 流程非常多样化,每一个步骤可选工具都非常多。我的选择是 StringTie 进行组装取得 read counts 数值,DESeq2 分析差异基因。这里把我方法跟大家共享。一来给新手一个指引,如果你毫无相关经验可以照着我这个出结果;二来抛砖引玉,如果你有相关经验欢迎一起交流进步。
总体流程
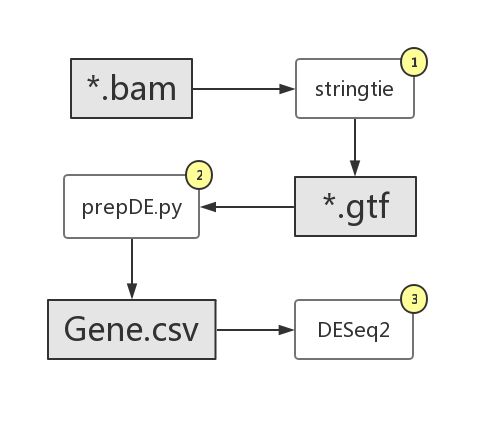
如流程图所示,总体上有三大步骤。第一,用 stringtie 组装取得每个样本结果 gtf 文件;第二,用 StringTie 提供的 prepDE.py 脚本从所有(需要)样本提取 read counts 数值并以矩阵格式存储到一个 csv 文件;第三,用 DESeq2 进行差异基因分析。
StringTie
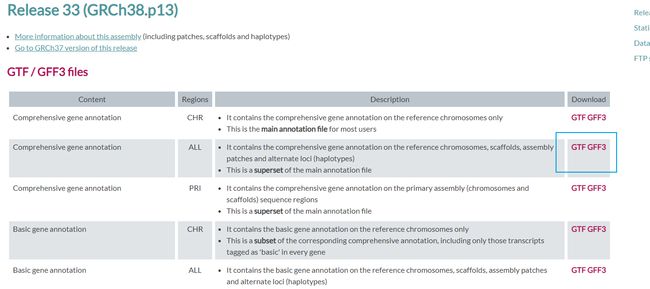
StringTie 的输入文件是排序好的 BAM 格式文件,所以比对得到 sam 文件后用 samtools 进行 sam->bam 格式转换,并对 bam 进行排序和建立索引文件。组装需要一个基因组注释文件,推荐去 genecode 下载。网址 GENCODE - Human Release 33。如下图所示下载 gtf/gff3 格式。
示例 stringtie 命令如下:
stringtie /Example/Bam/PC3_NC_1_sorted.bam -G /Example/GRCh38_hg38/gencode.v32.chr_patch_hapl_scaff.annotation.gff3 -o /Example/GTF/PC3_NC_1/PC3_NC_1.gtf -A /Example/GTF/PC3_NC_1/PC3_NC_1_abundance.txt -p 4 -B -e
其中 -G 参数指定基因组注释文件, -o 输出的 gtf 路径, -e 参数限定分析基因组注释文件转录本,也就是说只分析已知转录本,不分析新转录本。 -B 是产生文件给下游 Ballgown 使用,我们不使用 Ballgown 的话可以不需要指定。得到 gtf 后用 prepDE.py 转换到 read counts 矩阵。 prepDE.py 输入是目录路径,或者提供一个文件,文件里是你需要的 gtf 文件路径。像我当前目录包含了需要的 gtf 文件。那么输入当前目录路径给 prepDE.py 即可。
$find . -name "*.gtf"
./PC3_si730_2/PC3_si730_2.gtf
./PC3_si730_1/PC3_si730_1.gtf
./PC3_NC_2/PC3_NC_2.gtf
./PC3_NC_1/PC3_NC_1.gtf
./PC3_NC_3/PC3_NC_3.gtf
./PC3_si730_3/PC3_si730_3.gtf
假设就在当前目录运行,示例命令如下:
python prepDE.py -i . -l 150
其中 -l 是设置平均 reads 长度。 prepDE.py 计算 read counts 代码如下,read_len 就是 -l 参数。可见这个参数需要按实际实验去设置,默认值是75.
int(ceil(coverage*transcript_len/read_len)
运行后得到 gene_count_matrix.csv 和 transcript_count_matrix.csv 两个文件,其中 gene_count_matrix.csv 就是需要的基因 read counts 矩阵。查看一下。
gene_id,PC3_NC_1,PC3_NC_2,PC3_NC_3,PC3_si730_1,PC3_si730_2,PC3_si730_3
ENSG00000255427.1|LINC02707,0,0,0,0,0,0
ENSG00000227189.2|AC092535.2,0,2,0,5,0,0
ENSG00000244171.4|PBX2P1,1782,1921,1717,1320,1829,1704
ENSG00000122188.13|LAX1,3,3,0,3,0,0
ENSG00000225415.2|ACKR4P1,0,0,0,0,0,0
ENSG00000141736.13|ERBB2,4397,4340,3813,3544,4978,4346
ENSG00000284348.1|AC245128.33,0,0,0,0,0,0
ENSG00000273728.1|Metazoa_SRP,0,0,0,0,0,0
可见其 gene_id 是混合了 ensembl 和其他基因名,用 | 分隔,后续 DESeq2 流程我们需要根据这个进行相应处理。关于 ensembl id 可以查看我之前文章《Ensembl基因ID格式》了解。
DESeq2
DESeq2 是一个 R 包,每个人 R 代码习惯不同,所以下面每一步我都会展示结果/数据, 你不需要跟着我代码写,只要能做到相同数据结构就行。 DESeq2 是非常复杂强大的包,建议去官网把教程至少看一遍。
第一步先导入需要的 R 包。其中 biomaRt 是用于基因ID转换,包使用方法参见我以前文章《批量转换基因ID》。
library(tidyverse, quietly = TRUE)
library(DESeq2, quietly = TRUE)
library(biomaRt, quietly = TRUE)
DESeq2 的输入是 read counts 矩阵和样品信息表,样品信息主要是样品分组信息。在我这里是个简单的敲低实验,其中3个对照组3个实验组,分析要求是取得 实验组 vs 对照组 差异基因。我的样品信息就存在这样文件里:
$head SampleGroup.tsv
    Group
PC3_NC_1    Control
PC3_NC_2    Control
PC3_NC_3    Control
PC3_si730_1 Treatment
PC3_si730_2 Treatment
PC3_si730_3 Treatment
使用下面代码将表格读取进 R:
sampleGroup <- read.table("/Example/SampleGroup.tsv", header = TRUE)
sampleGroup$Group <- factor(sampleGroup$Group, levels = c("Control", "Treatment"))
print(sampleGroup)
这里我特意把分组列转换到因子,并且设定第一个因子水平为 Control. 这是用 R 的好习惯,在 R 语言里如果涉及到排序,往往默认按因子水平排。如果你的列表不是因子,会自动 as.factor 进行转换,采用默认的因子水平。返回 DESeq2 这里,把 Control 设为第一个因子,那么后面的结果就是 其他组 vs 对照组。在我这个例子里就是 Treatment vs Control 。假如说你有2组 A 和 C , C 是你的对照组,你希望是 A vs C 。如果你不设定 C 为第一个因子,那 DESeq2 默认 A 为第一个因子,结果就是 C vs A 。
使用下面代码读取 read counts 矩阵。
readCount <- read_csv("/Example/GTF/gene_count_matrix.csv") %>% tidyr::separate(col = gene_id, into = c("ensembl_gene_id", "gene_name"), sep = "\\|", remove = TRUE) %>% dplyr::select(ensembl_gene_id, rownames(sampleGroup)) %>% dplyr::mutate(ensembl_gene_id = map_chr(ensembl_gene_id, geneID)) %>% as.data.frame()
rownames(readCount) <- readCount$ensembl_gene_id
readCount$ensembl_gene_id <- NULL
print(head(readCount, n = 3))
这里 StringTie 给的结果基因ID是 ENSG00000214428.3|NPM1P10 这样的格式,其中竖线右边基因名是杂乱的,为了方便处理我把这部分移除了,只保留 Ensembl ID: ENSG00000214428 。后面再用 biomaRt 转换到 hgnc_symbol 。总而言之,处理后得到下面的数据框,这就是 DESeq2 需要的输入格式。要注意列名顺序跟样品信息 sampleGroup 的行名顺序是一致的。
                PC3_NC_1 PC3_NC_2 PC3_NC_3 PC3_si730_1 PC3_si730_2 PC3_si730_3
ENSG00000255427        0        0        0           0           0           0
ENSG00000227189        0        2        0           5           0           0
ENSG00000244171     1663     1793     1602        1232        1707        1591
刚刚说了要用 biomaRt 进行基因ID转换,下面是代码和结果示例,详情参见《批量转换基因ID》文章。
# 其中 is.na(hgnc_symbol) 或许应该替换为 hgnc_symbol == ""
ensembl <- useMart("ensembl", dataset="hsapiens_gene_ensembl")
geneMap <- getBM(attributes = c("ensembl_gene_id", "hgnc_symbol", "entrezgene_id"), filters = "ensembl_gene_id", values = rownames(readCount), mart = ensembl) %>% dplyr::filter(!(is.na(hgnc_symbol) & is.na(entrezgene_id))) %>% dplyr::distinct(ensembl_gene_id, .keep_all = TRUE)
print(head(geneMap, n = 3))

# 得到如下表格
  ensembl_gene_id hgnc_symbol entrezgene_id
1 ENSG00000010404         IDS          3423
2 ENSG00000013293     SLC7A14         57709
3 ENSG00000029534        ANK1           286
使用下面代码将数据导入 DESeq2 。
dds <- DESeqDataSetFromMatrix(countData = readCount, colData = sampleGroup, design = ~ Group)
keep <- rowSums(counts(dds)) > 12
dds <- dds[keep, ]
dds <- DESeq(dds)
print(resultsNames(dds))

# 打印输出
[1] "Intercept"                  "Group_Treatment_vs_Control"
函数 DESeqDataSetFromMatrix 将 read counts 矩阵和样品信息导入到 DESeq2 。其中 design 参数设定实验设计,也即那一列信息用于分组比较(也包括批次效应或其他因素,在我这例子里没有)。后面的 keep 是移除低 read counts 基因,这里也没有一个数值标准,看自己想法。我这里是要求每个基因平均 read counts > 2 ,我有6样本所以要求总 read counts > 12 。只保留符合条件的基因。像 edgeR 的话是推荐按照 cpm(count-per-million) 进行筛选而不是直接对 read counts 筛选,比如 keep <- rowSums(cpm(dds)>1) >= 2 也可以参考一下这个方法。
用 results 函数取的差异基因结果,这个结果包含所有基因。
res <- results(dds, name = "Group_Treatment_vs_Control") %>% as_tibble(rownames = "ensembl_gene_id") %>% dplyr::left_join(geneMap, by = "ensembl_gene_id") %>% dplyr::select(ensembl_gene_id, hgnc_symbol, entrezgene_id, everything())
print(head(res, n = 3))
用 name 参数选择需要的比较组,也可以用 contrast 参数设置比较组。results 函数有个 lfcThreshold 参数跟P值计算直接相关,默认是0所以检验的是基因表达有无差异,如果你想检验基因表达是否差2倍以上,可以设为1。同时我们把基因ID匹配上去。得到差异基因结果如下:
# A tibble: 3 x 9
  ensembl_gene_id hgnc_symbol entrezgene_id baseMean log2FoldChange lfcSE   stat

1 ENSG00000244171 PBX2P1                 NA   1583.         -0.123  0.118 -1.04
2 ENSG00000141736 ERBB2                2064   3916.          0.0734 0.105  0.702
3 ENSG00000268324 LRRC2-AS1              NA     15.8         1.20   0.860  1.40
# … with 2 more variables: pvalue , padj
得到结果后可以根据自己需要设置条件筛选,比如:
degFilter <- dplyr::filter(res, abs(log2FoldChange) >= 1 & padj < 0.05)
DESeq2 提供了log2差异倍数(log2 fold change)收缩方法 lfcShrink ,跟原始的 results 取的结果相比会把差异倍数进行一定缩小。 lfcShrink 官方文档如下:
Beginning with the first row, all shrinkage methods provided by DESeq2 are good for ranking genes by “effect size”, that is the log2 fold change (LFC) across groups, or associated with an interaction term. It is useful to contrast ranking by effect size with ranking by a p-value or adjusted p-value associated with a null hypothesis: while increasing the number of samples will tend to decrease the associated p-value for a gene that is differentially expressed, the estimated effect size or LFC becomes more precise. Also, a gene can have a small p-value although the change in expression is not great, as long as the standard error associated with the estimated LFC is small.
总体而言缩放数据更适合去可视化以及进行排序等,像我们后面需要进行GSEA分析,那么可以采用这个数据。有3种缩放方法,官方给出下面总结:
示例代码:
deg <- lfcShrink(dds, coef = "Group_Treatment_vs_Control", type = "apeglm") %>% as_tibble(rownames = "ensembl_gene_id") %>% dplyr::left_join(geneMap, by = "ensembl_gene_id") %>% dplyr::select(ensembl_gene_id, hgnc_symbol, entrezgene_id, everything())
print(head(deg, n = 3))

# 打印输出
# A tibble: 3 x 8
  ensembl_gene_id hgnc_symbol entrezgene_id baseMean log2FoldChange   lfcSE

1 ENSG00000244171 PBX2P1                 NA   1583.     -0.0000311  0.00144
2 ENSG00000141736 ERBB2                2064   3916.     -0.00000352 0.00144
3 ENSG00000268324 LRRC2-AS1              NA     15.8     0.00000157 0.00144
# … with 2 more variables: pvalue , padj
除了差异基因数据,往往我们还需要表达数据用于其他分析。 DESeq2 提供 rlog 函数将原始 read counts 转换为 log2 后值并且进行调整。得到的矩阵适合后续机器学习相关分析,比如聚类、热图展示等。如果你样本数很多,建议使用 vst 函数,会快非常多。代码示例。
rld <- rlog(dds)
rldt <- assay(rld) %>% as_tibble(rownames = "ensembl_gene_id") %>% dplyr::left_join(geneMap, by = "ensembl_gene_id") %>% dplyr::select(ensembl_gene_id, hgnc_symbol, entrezgene_id, everything())
print(head(rldt, n = 3))

# 输出
# A tibble: 3 x 9
  ensembl_gene_id hgnc_symbol entrezgene_id PC3_NC_1 PC3_NC_2 PC3_NC_3

1 ENSG00000244171 PBX2P1                 NA    10.6     10.7     10.7
2 ENSG00000141736 ERBB2                2064    11.9     11.9     11.9
3 ENSG00000268324 LRRC2-AS1              NA     3.84     3.84     3.87
# … with 3 more variables: PC3_si730_1 , PC3_si730_2 ,
#   PC3_si730_3
使用 counts 函数取的 normalized 后 read counts 数据,记得参数 normalized = TRUE .
nReadCount <- counts(dds, normalized = TRUE) %>% as_tibble(rownames = "ensembl_gene_id") %>% dplyr::left_join(geneMap, by = "ensembl_gene_id") %>% dplyr::select(ensembl_gene_id, hgnc_symbol, entrezgene_id, everything())
print(head(nReadCount, n = 3))

# 输出
# A tibble: 3 x 9
  ensembl_gene_id hgnc_symbol entrezgene_id PC3_NC_1 PC3_NC_2 PC3_NC_3

1 ENSG00000244171 PBX2P1                 NA  1575.    1678.     1698.
2 ENSG00000141736 ERBB2                2064  3888.    3789.     3772.
3 ENSG00000268324 LRRC2-AS1              NA     8.53     8.42     11.7
# … with 3 more variables: PC3_si730_1 , PC3_si730_2 ,
#   PC3_si730_3
参考
StringTie
Analyzing RNA-seq data with DESeq2


