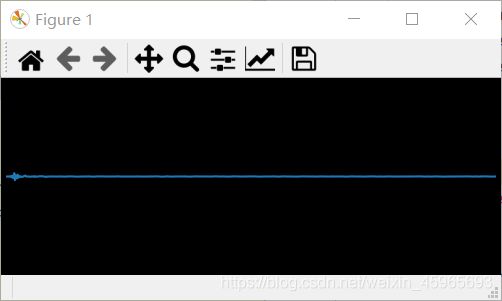
波形图实时显示(无杂音)
版本0.2

目前没有加语谱图,原因是加上后可能由于FFT计算量大,会出现卡顿的情况
import os
import wave
import pyaudio
import random
import numpy as np
import matplotlib.pyplot as plt
import matplotlib.animation as animation
import matplotlib.lines as line
from matplotlib.backends import backend_wxagg
from multiprocessing import Process, Queue, freeze_support
from threading import Thread
import time
import ctypes

# 队列相当于缓存,用于保存数据
q = Queue(10)


def cb(cb_q):
    def callback(in_data, frame_count, time_info, status):  # all parameters are need!
        rt_data = np.frombuffer(in_data, np.dtype('))
        val_list = np.hsplit(rt_data, 32)
        avg_list = [each.mean() for each in val_list]  # data average
        if cb_q.full():
            cb_q.get()
        cb_q.put(avg_list)
        return None, pyaudio.paContinue
    return callback


class Lintener(Process):
    def __init__(self, _q):
        Process.__init__(self)
        self.q = _q
        self.CHUNK = 1024
        self.FORMAT = pyaudio.paInt16
        self.CHANNELS = 2
        self.RATE = 44100

    def run(self):
        p = pyaudio.PyAudio()
        p.open(format=self.FORMAT,
               channels=self.CHANNELS,
               rate=self.RATE,
               input=True,
               frames_per_buffer=self.CHUNK,
               stream_callback=cb(self.q))
        while True:
            pass


if __name__=="__main__":
    freeze_support()
    fig = plt.figure(1, figsize=(5, 2), facecolor='#000000',)
    x_length = 768
    plt.axes(xlim=(0, x_length), ylim=(-20000, 20000))
    y_data = [0 for _ in range(x_length)]
    line, = plt.plot(y_data)
    plt.axis('off')  # hide axis
    plt.xticks([])  # hide coordinate scale
    plt.yticks([])  # hide coordinate scale
    plt.subplots_adjust(left=0.01, right=0.99, top=0.99, bottom=0.01)
    plt.draw()
    t = time.time()
    listener = Lintener(q)
    listener.start()
    #while time.time() < t + 4:
    while True:
        if not q.empty():
            y_data = y_data[32:] + q.get()
            line.set_xdata(np.arange(0, 768, 1))
            line.set_ydata(y_data)
            try:
                fig.canvas.draw()
                fig.canvas.flush_events()
                plt.pause(0.02)
            except TclError:
                print('stream stopped')
                break
    listener.terminate()
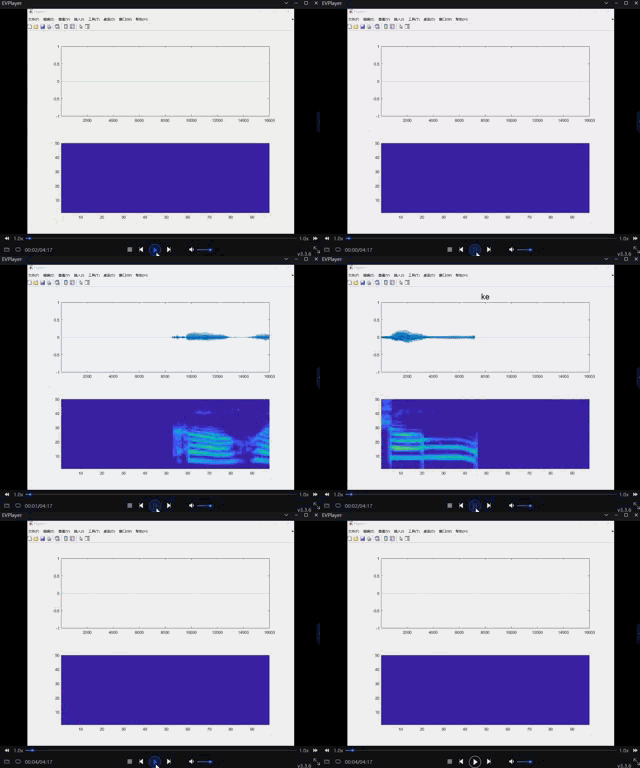
同为“厨余垃圾”。对比之前的版本,以上的算法明显没有噪音显示了,分析原因,可能是由于原来的算法获得了语音数据后进行了转码然后再画图,而以上代码使用了c语音,其中cb函数处理数据。


版本0.1
'''用于从麦克风实时传输和显示数据
1. 使用pyaudio从音频接口读出数据
2. 然后使用struct将二进制数据转换为int
3. 然后使用matplotlib显示
4. 使用librosa做FFT,显示频谱
'''
import pyaudio
import os
import struct
import numpy as np
import matplotlib.pyplot as plt
from scipy.fftpack import fft
import time
from tkinter import TclError

# 常量
CHUNK = 1024 * 2             # 每帧采样数
FORMAT = pyaudio.paInt16     # 音频格式(每个样本的字节数?)
CHANNELS = 1                 # 麦克风单通道
RATE = 44100                 # 每秒采样数

# 创建matplotlib图形和轴
fig, (ax1, ax2) = plt.subplots(2, figsize=(15, 7))

# pyaudio类实例
p = pyaudio.PyAudio()

# 从麦克风获取数据的流对象
stream = p.open(
    format=FORMAT,
    channels=CHANNELS,
    rate=RATE,
    input=True,
    output=True,
    frames_per_buffer=CHUNK
)

# 用于画图的变量
x = np.arange(0, 2 * CHUNK, 2)  # samples (waveform)

# 使用随机数据创建线对象
line, = ax1.plot(x, np.random.rand(CHUNK), '-', lw=1, alpha=0.6)

# 波形轴格式
ax1.set_title('AUDIO WAVEFORM')
ax1.set_xlabel('samples')
ax1.set_ylabel('volume')
ax1.set_ylim(0, 255)
ax1.set_xlim(0, 2 * CHUNK)
plt.setp(ax1, xticks=[0, CHUNK, 2 * CHUNK], yticks=[0, 128, 255])
print('stream started')

while True:
    # 二进制数据
    data = stream.read(CHUNK)
    # 将数据转换为整数,生成np数组,然后将其偏移127
    data_int = struct.unpack(str(2 * CHUNK) + 'B', data)
    # 创建np数组并偏移128
    data_np = np.array(data_int, dtype='b')[::2] + 128
    line.set_ydata(data_np)
    # 计算FFT和更新行
    ax2.specgram(data_int, NFFT=512, Fs=44100, noverlap=500, scale_by_freq=True, sides='default')

    # 更新图形画布
    try:
        fig.canvas.draw()
        fig.canvas.flush_events()
        plt.pause(0.02)

    except TclError:
        print('stream stopped')
        break
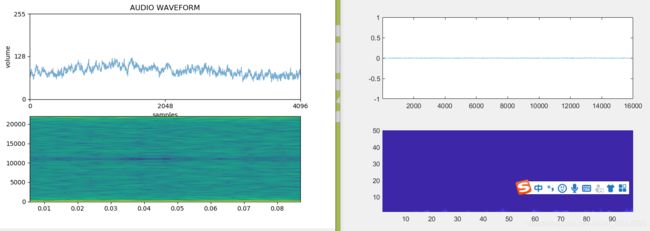
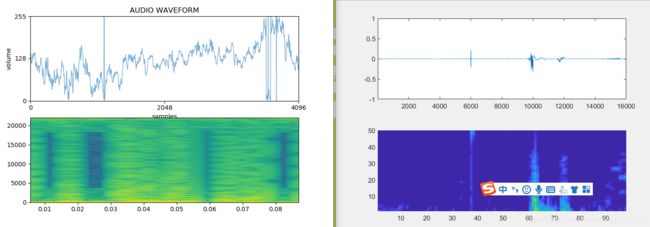
与matlab对比最好的效果如下,但是可以看出杂音还是很多的
推门

安静

原版
clear all;clc;
fs = 16000;
classificationRate = 40;
adr = audioDeviceReader('SampleRate',fs,'SamplesPerFrame',floor(fs/classificationRate));
audioBuffer = dsp.AsyncBuffer(fs);
h = figure('Units','normalized','Position',[0.2 0.1 0.6 0.8]);

timeLimit = Inf;

tic;
while ishandle(h) && toc < timeLimit
    x = adr()
    write(audioBuffer,x);
    y = read(audioBuffer,fs,fs-adr.SamplesPerFrame)
    spec = helperExtractAuditoryFeatures(y,fs);

    % Plot the current waveform and spectrogram.
    subplot(2,1,1)
    plot(y)
    axis tight
    ylim([-1,1])

    subplot(2,1,2)
    pcolor(spec')
    caxis([-4 2.6445])
    shading flat

    drawnow
