Matlab论文作图
一个函数
x=[0:0.01:10];
y=sin(x);
plot(x,y),xlabel('x'),ylabel('sin(x)'),title('sin(x) graph');grid on;
------------------------------------
多个函数
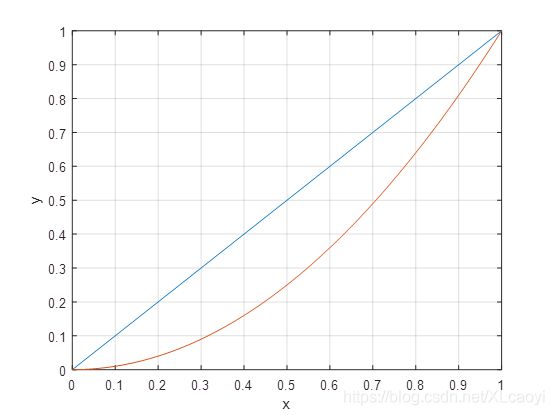
x=[0:0.01:1];
y1=x;
y2=x.*x;
plot(x,y1,x,y2),xlabel('x'),ylabel('y');grid on;
--------------------------------------------------------
不同属性的点
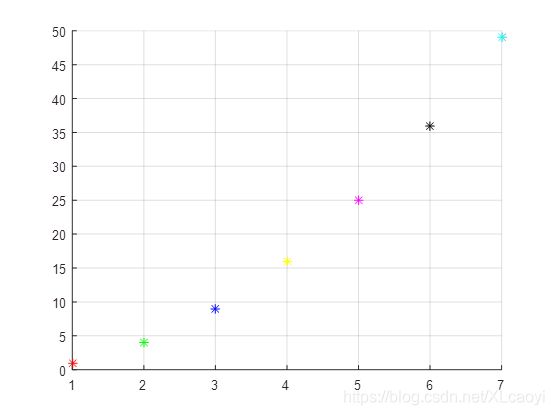
x=1:1:7;
y=power(x,2);
color={'*r','*g','*b','*y','*m','*k','*c'};
for i=1:7
    hold on;
    plot(x(i),y(i),color{i});grid on;
end
-----------------------------------------------------------------------
折线图
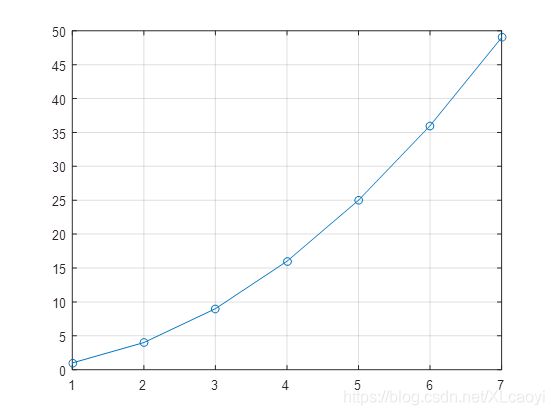
x=1:1:7;
y=power(x,2);
plot(x,y,'-o');grid on;
-------------------------------------------------------------------
柱状图
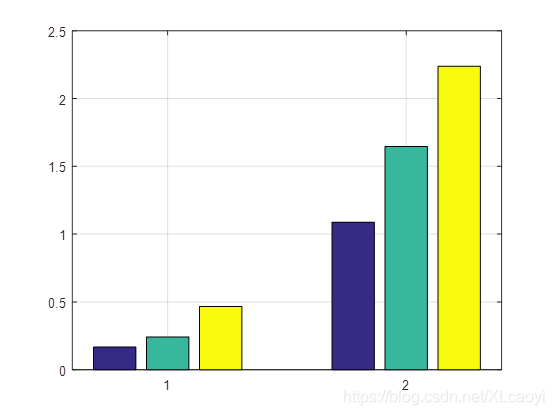
y=[0.1666666,0.241379,0.466666;1.086957,1.647059,2.238095];
bar(y);
------------------------------------------------------------
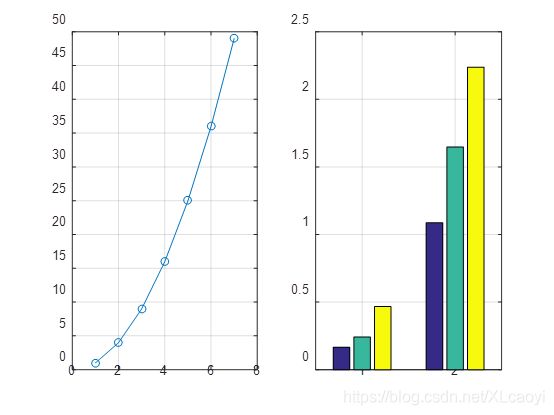
组合图
x1=1:1:7;
y1=power(x,2);

y2=[0.1666666,0.241379,0.466666;1.086957,1.647059,2.238095]

subplot(1,2,1);
plot(x1,y1,'-o');grid on;
subplot(1,2,2);
bar(y2);grid on;
------------------------------------------------------------
黑白版面多折线图
x=0:0.1:1
y1=x
y2=x.*x
y3=x.*x.*x
plot(x,y1,'h-');hold on
plot(x,y2,'s-.');hold on
plot(x,y3,'d--')
legend('y=x','y=x*x','y=x*x*x')
