ggplot绘制箱线图2(双数据箱线图,子母图)
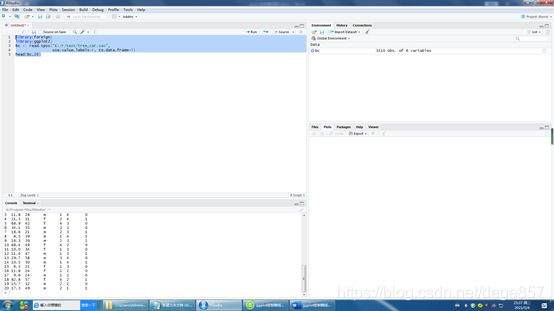
上一节我们已经简单已介绍了箱线图原理和单个数据的箱线图表示,今天我们来介绍多数据的箱线图和一些其他扩展,继续使用我们原来的汽车销售数据,我们先把数据和R包导入,
library(foreign)
library(ggplot2)
bc <- read.spss("E:/r/test/tree_car.sav",
                use.value.labels=F, to.data.frame=T)
head(bc,20)


我们来看下数据,car就是汽车售价,age是年龄,gender是性别,inccat是收入,这里分成4个等级,ed是教育程度,这里分为5个等级,marital表示是否结婚.我们处理一下数据,把分类变量转换成因子,然后加上一个标签。
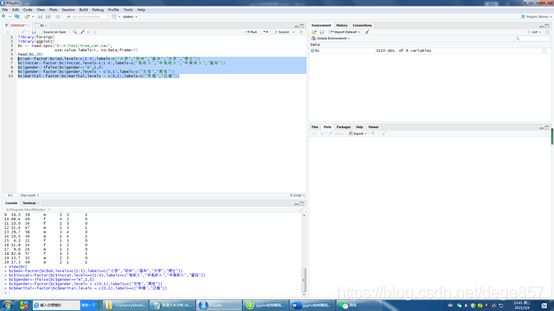
bc$ed<-factor(bc$ed,levels=c(1:5),labels=c("小学","初中","高中","大学","博士"))
bc$inccat<-factor(bc$inccat,levels=c(1:4),labels=c("低收入","中低收入","中等收入","富裕"))
bc$gender<-ifelse(bc$gender=="m",1,0)
bc$gender<-factor(bc$gender,levels = c(0,1),labels=c("女性","男性"))
bc$marital<-factor(bc$marital,levels = c(0,1),labels=c("未婚","已婚"))

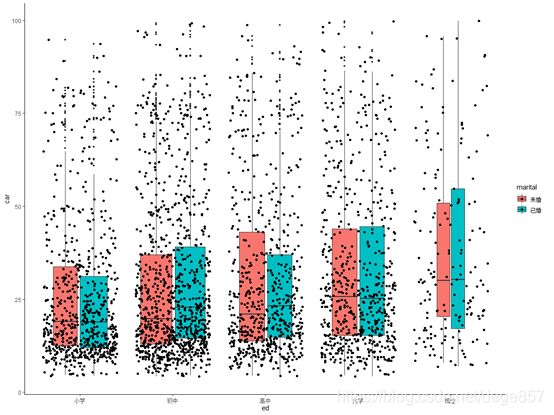
假如我们想知道是否结婚在不同教育水平患者买车价格是否存在差异,开始先做双数据箱型图
ggplot(bc,mapping = aes(x=ed,y=car))+
  geom_boxplot(outlier.size=1,aes(fill=factor(marital)),notch = F,varwidth = T)+
  guides(fill=guide_legend(title = "marital"))+
  theme_classic()
ggplot(bc,mapping = aes(x=ed,y=car))+
  geom_boxplot(outlier.size=1,aes(fill=marital),notch = F,varwidth = T)+
  geom_jitter(aes(fill=marital))+
  guides(fill=guide_legend(title = "marital"))+
  theme_classic()

假如我们想知道在不同性别中,年龄和买车价格的关系,可以做散点和箱线图结合做成子母图形表示
先要导入2个R包
library(ggpubr)
library(grid)
然后作图
p1<-ggplot(bc,aes(age,car,fill=marital))+
  geom_point(size=3,shape=21,col="black")+
  theme_bw()+
  xlim(20,80)+
  theme_light()
p2<-ggplot(bc,aes(marital,car,fill=marital))+
  geom_boxplot()+
  theme_bw()+
  ggtitle("boxplot")+
  theme_light()
subvp<-viewport(x=0.78,y=0.38,width=0.4,height = 0.5)
p1
print(p2,vp=subvp)
p1<-ggplot(bc,aes(age,car,fill=marital))+
  geom_point(size=3,shape=21,col="black")+
  scale_fill_manual(values= c("#00AFBB", "#E7B800"))+
  theme(axis.title = element_text(size = 16),
        axis.text = element_text(size = 14),
        plot.title = element_text(hjust = 0.5),
        legend.position = "none")+
  xlim(20,80)+
  theme_light()
p2<-ggplot(bc,aes(marital,car,fill=marital))+
  geom_boxplot()+
  scale_fill_manual(values= c("#00AFBB", "#E7B800"))+
  theme(plot.background = element_blank(),
      panel.background= element_blank(),
      panel.grid.minor= element_blank(),
      panel.grid.major.y= element_blank(),
      axis.title = element_blank(),
      axis.text = element_text(size = 10,colour="black"),
      plot.title = element_text(hjust = 0.5),
      legend.position = "none")+
  ggtitle("boxplot")+
  theme_classic()
subvp<-viewport(x=0.78,y=0.38,width=0.4,height = 0.5)
p1
print(p2,vp=subvp)


