python机器学习——欠拟合,过拟合实例
欠拟合,过拟合实例
以“比萨饼价格预测”问题为例,分别用 1 次, 2 次和 4 次函数去拟合,然后看看在测试数据上的表现。

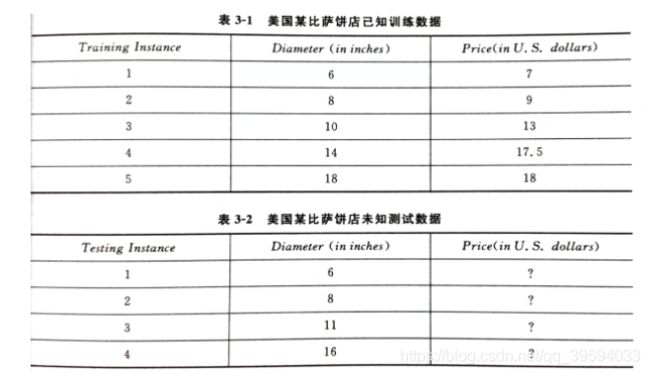
如表 3-1 所示,美国一家披萨店出手不同尺寸的比萨,其中每种直径( Diameter )都对应一个报价。我们所要做的是设计一个线性模型,可以有效地根据表 3-2 中比萨的直径特征来预测售价。
目前我们所知,共有 5 组训练数据、4 组测试数据,并且其中测试数据的披萨报价未知。根据我们的经验,如果只考虑比赛的尺寸与售价的关系,可以使用线性回归模型建模:
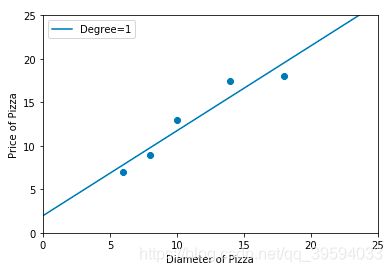
(1)使用线性回归模型在比萨训练样本上进行拟合
# 输入训练样本的特征以及目标值,分别存储在变量 X_train 与 y_train 之中
X_train = [[6], [8], [10], [14], [18]]
y_train = [[7], [9], [13], [17.5], [18]]
# 从 sklearn.linear_model 中导入 LinearRegression。
from sklearn.linear_model import LinearRegression
# 使用默认配置初始化线性回归模型。
regressor = LinearRegression()
# 直接以披萨的直径作为特征训练模型。
regressor.fit(X_train, y_train)
# 导入 numpy 并且重命名为 np。
import numpy as np
# 在 x 轴上从 0 至 25 均匀采样 100 个数据点。
xx = np.linspace(0, 26, 100)
xx = xx.reshape(xx.shape[0], 1)
# 以上述 100 个数据点作为基准,预测回归直线。
yy = regressor.predict(xx)
# 对回归预测到的直线进行作图。
import matplotlib.pyplot as plt
plt.scatter(X_train, y_train)
plt1, = plt.plot(xx, yy, label="Degree=1")
plt.axis([0, 25, 0, 25])
plt.xlabel('Diameter of Pizza')
plt.ylabel('Price of Pizza')
plt.legend(handles = [plt1])
plt.show()

# 输出线性回归模型在训练样本上的 R-squared 值。
print ('The R-squared value of Linear Regressor performing on the training data is', regressor.score(X_train, y_train))


输出显示,线性回归模型在训练集上的 R 2 R^2 R2 约为 0.910 ,我们进一步猜测,也许比萨饼的面积与售价的线性关系更加明显,于是接下来使用 2 次多项式回归对训练样本拟合。
(2)使用 2 次多项式回归模型在比萨训练样本上进行拟合
# 从 sklearn.preproessing 中导入多项式特征产生器
from sklearn.preprocessing import PolynomialFeatures
# 使用 PolynominalFeatures( degree=2 ) 映射出 2 次多项式特征,存储在变量 X_train_poly2 中。
poly2 = PolynomialFeatures(degree=2)
X_train_poly2 = poly2.fit_transform(X_train)
# 以线性回归器为基础,初始化回归模型。尽管特征的维度有提升,但是模型基础仍然是线性模型。
regressor_poly2 = LinearRegression()
# 对 2 次多项式回归模型进行训练。
regressor_poly2.fit(X_train_poly2, y_train)
# 从新映射绘图用 x 轴采样数据。
xx_poly2 = poly2.transform(xx)
# 使用 2 次多项式回归模型对应 x 轴采样数据进行回归预测。
yy_poly2 = regressor_poly2.predict(xx_poly2)
# 分别对训练数据点、线性回归直线、2 次多项式回归曲线进行作图。
plt.scatter(X_train, y_train)
plt1, = plt.plot(xx, yy, label='Degree=1')
plt2, = plt.plot(xx, yy_poly2, label='Degree=2')
plt.axis([0, 25, 0, 25])
plt.xlabel('Diameter of Pizza')
plt.ylabel('Price of Pizza')
plt.legend(handles=[plt1, plt2])
plt.show()
# 输出 2 次多项式回归模型在训练样本上的 R-squared 值。

print('The R-squared value of Polynominal Regressor (Degree=2) performing on the training data is',
    regressor_poly2.score(
    X_train_poly2, y_train))

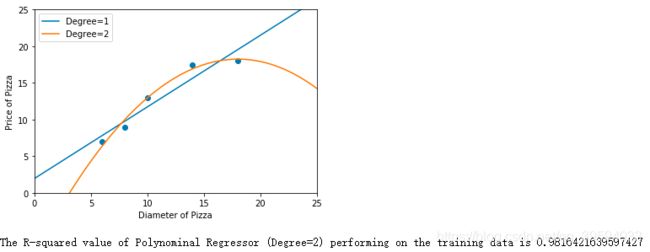
果然,升高了特征维度之后,模型在训练样本上性能表现更突出,R^2 升为 0.982 。由此,进一步升高维度建模测试。
(3)使用 4 次多项式回归模型在比萨训练样本上进行拟合
# 从 sklearn.preprocessing 导入多项式特征生成器。
from sklearn.preprocessing import PolynomialFeatures
# 初始化 4 次多项式特征生成器。
poly4 = PolynomialFeatures(degree=4)
X_train_poly4 = poly4.fit_transform(X_train)
# 使用默认配置初始化 4 次多项式回归器。
regressor_poly4 = LinearRegression()
# 对 4 次多项式回归模型进行训练。
regressor_poly4.fit(X_train_poly4, y_train)
# 从新映射绘图用 x 轴采样数据。
xx_poly4 = poly4.transform(xx)
# 使用 4 次多项式回归模型对应 x 轴采样数据进行回归预测。
yy_poly4 = regressor_poly4.predict(xx_poly4)
# 分别对训练数据点、线性回归直线、2 次多项式以及 4 次多项式回归曲线进行作图。
plt.scatter(X_train, y_train)
plt1, = plt.plot(xx, yy, label='Degree=1')
plt2, = plt.plot(xx, yy_poly2, label='Degree=2')
plt4, = plt.plot(xx, yy_poly4, label='Degree=4')
plt.axis([0, 25, 0, 25])
plt.xlabel('Diameter of Pizza')
plt.ylabel('Price of Pizza')
plt.legend(handles=[plt1, plt2, plt4])
plt.show()
print ('The R-squared value of Polynominal Regressor (Degree=4) performing on the training data is',
    regressor_poly4.score(
    X_train_poly4, y_train))

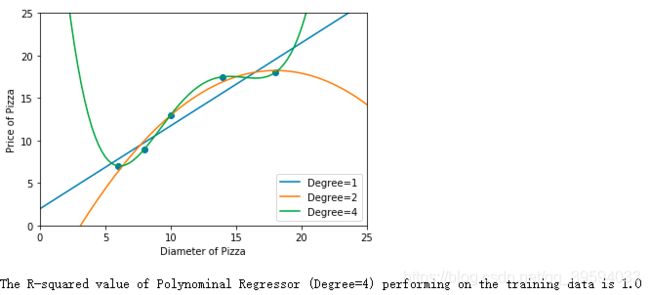
输出显示,4 次多项式曲线几乎完全拟合了所有的训练点,对于的 R^2 为 1 。但是这就是“真”模型吗?显然该模型出现了过拟合。
(4)评估 3 种回归模型在测试数据集上的性能表现
# 准备测试数据。
X_test = [[6], [8], [11], [16]]
y_test = [[8], [12], [15], [18]]
# 使用测试数据对线性回归模型的性能进行评估。
regressor.score(X_test, y_test)

# 使用测试数据对 2 次多项式回归模型的性能进行评估。
X_test_poly2 = poly2.transform(X_test)
regressor_poly2.score(X_test_poly2, y_test)

# 使用测试数据对 4 次多项式回归模型的性能进行评估。
X_test_poly4 = poly4.transform(X_test)
regressor_poly4.score(X_test_poly4, y_test)
我们整理了一下,模型评估的表格
① 在升高了特征维度后,2 次多项式回归模型在训练样本上的性能高于线性回归模型,R-squared 值从 0.910 上升到 0.982 ,对训练数据的拟合程度也增加了许多;进一步升高维度,4 次多项式曲线几乎完全拟合了所有的训练数据点,对应的 R-squared 为 1.0 、
② 三种模型在测试集上的表现不同:当模型复杂度很低( degree = 1 )时,模型不仅没有对训练集上的数据有良好的拟合状态,而且在测试集上也表现平平——欠拟合;然而当一味追求很高的模型复杂度( degree = 4 )时,尽管模型几乎完全拟合了所有的训练数据,但模型也变得非常波动,几乎丧失了对未知数据的预测能力——过拟合。
综合来看,应该避免上面两种情况,兼顾模型的泛化能力,因此应选择模型复杂度适中( degree = 2 )的模型。
参考文献
[1] 范淼,李超.Python 机器学习及实践[M].清华大学出版社, 北京, 2016.

