MATLAB学习日记3绘图2
1、有关log的特殊的绘图

x=logspace(-1,1,100); //在x取值在10^-1~10^1,取100点
y=x.^2;
subplot(2,2,1);
plot(x,y);
title('Plot');
subplot(2,2,2);
semilogx(x,y);
title('semilogx');
subplot(2,2,3);
semilogy(x,y);
title('Semilogy');
subplot(2,2,4);
loglog(x,y);
title('Loglog');
set(gca,'XGrid','on');//在x轴上画网格线
运行

2、将两个图画在一起,并且y轴放置不同的函数,plotyy(x,y1,x,y2);
x=0:0.01:20;
y1=200*exp(-0.5*x).*sin(x);
y2=-0.8*exp(-0.5*x).*sin(10*x);
[AX,H1,H2]=plotyy(x,y1,x,y2); //[AX,H1,H2] = plotyy(...) returns the handles of the two axes created in AX and the handles of the graphics objects from each plot in H1 and H2. AX(1) is the left axes and AX(2) is the right axes.
set(get(AX(1),'Ylabel'),'String','Left Y-axis')
set(get(AX(2),'Ylabel'),'String','Right Y-axis')
title('Labeling ploty');
set(H1,'Linestyle','--'); //set的用法set(H,'PropertyName',PropertyValue)
set(H2,'Linestyle',';');
运行结果

3、生成数据矩形图,Histogram
hist(x,m);
y = randn(1,1000); //生成一个1*1000的随机矩阵
subplot(2,1,1);
hist(y,10); //将生成的矩阵元素等分成十份并生成相应的直方图columns
title('Bins = 10');
subplot(2,1,2);
hist(y,50);
title('Bins = 50');

4、生成柱状图,bar graph
bar(x);
bar(y);
bar3(y);
x=[1 2 5 4 8];
y=[x;1:5];
subplot(1,3,1);
bar(x);  //生成有关x的直方图
title('A bargraph of Vector x');
subplot(1,3,2);
bar(y);  //生成 x与y 的直方图
title('A bargraph of Vector y');
subplot(1,3,3);
bar3(y); 生成x与y的3d图
title('A 3D bargraph');
PS:如何改变柱状图的填充颜色
handle = bar(Y);
set(handle, 'facecolor', [255/255 0/255 0/255]);
运行

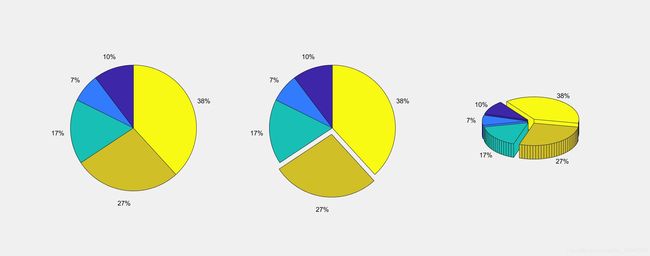
5、生成饼状图,pie chair
pie(a);
pie(a,[0 0 0 ]);
pie3(a);
a=[21 15 34 56 78 ];
subplot(1,3,1);
pie(a);
title('饼状图');
subplot(1,3,2);
pie(a,[0 0 0 1 0]);  //0表示拼接在一起,1表示分块
title('分块饼状图');
subplot(1,3,3);
pie3(a,[1 1 1 1 1 ]);
title('分块3D图');
6、生成polar chart 极坐标图
theta 表示角度
r表示半径
theta = linspace(0,2*pi,7);  //linspace表示 在0-2pi之间,均等分八份
r =ones(1,length(theta));    //ones(m,n);表示生成一个m*n的矩阵,且矩阵的元素均为1
                             //length(x),表示返回x的值
polar(theta,r);

**
PS:
1、plot(x,y);与plot(x,y);的区别
x坐标不同。
第一个是以参数x为横坐标
第二个以默认的1,2 ,3,4 为坐标值。个数为你的数据个数。
2、bar(x,y);生成xy的矩阵
bar(Y) 生成1y的矩阵
7、Color Space
[R G B]分别对应一个[255 255]的矩阵
8、画三维图像
plot3(x,y,z);
grid on;