opencv图像处理中的一些滤波器+利用滤波器提取条形码(解析二维码)+公交卡倾斜矫正+物体尺寸丈量
一般来说,图像的能量主要集中在其低频部分,噪声所在的频段主要在高频段,同时图像中的细节信息也主要集中在其高频部分,因此,如何去掉高频干扰同时又保持细节信息是关键。为了去除噪声,有必要对图像进行平滑,可以采用低通滤波的方法去除高频干扰。图像平滑包括空域法和频域法两大类。在空域法中,图像平滑的常用方法是采用均值滤波或中值滤波。对于均值滤波,它是用一个有奇数点的滑动窗口在图像上滑动,将窗口中心点对应的图像像素点的灰度值用窗口内的各个点的灰度值的平均值代替,如果滑动窗口规定了取均值过程中窗口各个像素点所占的权重,也就是各个像素点的系数,这时候就称为加权均值滤波;对于中值滤波,对应的像素点的灰度值用窗口内的中间值代替。
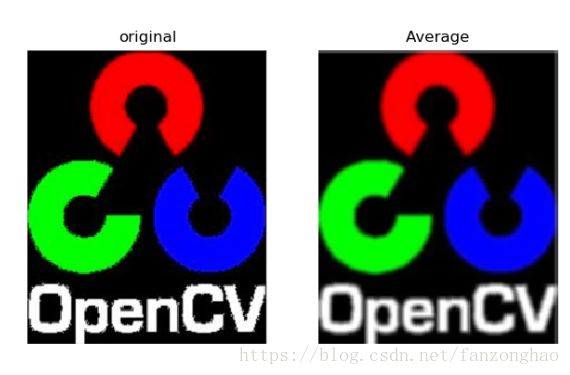
一,平滑均值滤波,奇数尺寸,参数和为1,大致的整体描述而模糊一幅图像,忽略细小的细节,缺点没有去除噪声,反而让图像模糊,代码,
"""
平滑滤波
"""
def average_filter():
    img=cv2.imread('./data/opencv_logo.png')
    kernel=np.ones(shape=(5,5),dtype=np.float32)/25
    dst=cv2.filter2D(src=img,ddepth=-1,kernel=kernel)
    plt.subplot(121)
    plt.imshow(img)
    plt.title('original')
    plt.axis('off')
    plt.subplot(122)
    plt.imshow(dst)
    plt.title('Average')
    plt.axis('off')
    plt.show()
打印结果:
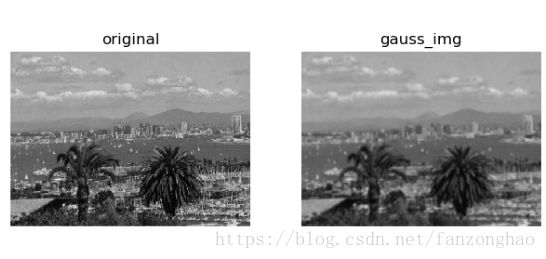
二,平滑高斯滤波,模拟人眼关注中心区域,有效去除高斯噪声
"""
高斯滤波
"""
def image_gauss():
    img = cv2.imread('./data/img.png')

    gauss_img = cv2.GaussianBlur(img, (7, 7),0)
    plt.subplot(121)
    plt.imshow(img)
    plt.title('original')
    plt.axis('off')
    plt.subplot(122)
    plt.imshow(gauss_img)
    plt.title('gauss_img')
    plt.axis('off')
    plt.show()
打印结果:
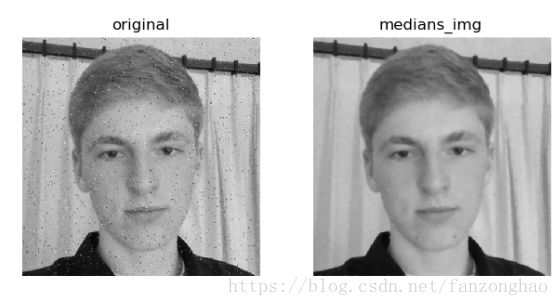
三,中值滤波,卷积域内的像素值从小到大排序,取中间值作为卷积输出,有效去除椒盐噪声
"""
中值滤波
"""
def image_median():
    img = cv2.imread('./data/img1.png')

    median_img = cv2.medianBlur(img,5)
    plt.subplot(121)
    plt.imshow(img)
    plt.title('original')
    plt.axis('off')
    plt.subplot(122)
    plt.imshow(median_img)
    plt.title('medians_img')
    plt.axis('off')
    plt.show()
打印结果:
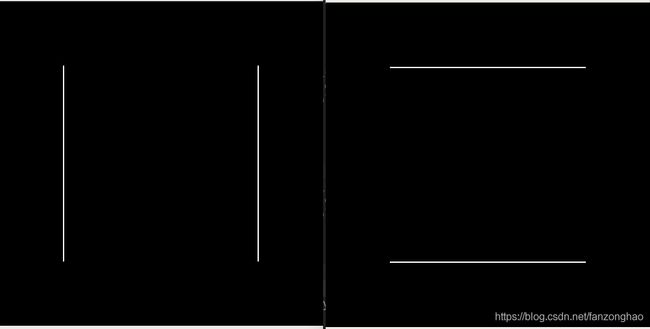
四,Sobel算子
def Sobel(src, ddepth, dx, dy, dst=None, ksize=None, scale=None, delta=None, borderType=None)Sobel算子依然是一种过滤器,只是其是带有方向的。
前四个是必须的参数:
- 第一个参数是需要处理的图像;
- 第二个参数是图像的深度,-1表示采用的是与原图像相同的深度。目标图像的深度必须大于等于原图像的深度;
- dx和dy表示的是求导的阶数,0表示这个方向上没有求导,一般为0、1、2。
img=cv2.imread('img.jpg')
print(img.shape)
gray=cv2.cvtColor(img,cv2.COLOR_RGB2GRAY)

#[[-1,0,1],
# [-2,0,2],
# [-1,0,1]]
solber_x=cv2.Sobel(gray,cv2.CV_64F,1,0,ksize=3)
solber_x=cv2.convertScaleAbs(solber_x)
cv2.imshow('solber_x',solber_x)
cv2.waitKey(0)

#[[-1,-2,-1],
# [0,0,0],
# [1,2,1]]
solber_y=cv2.Sobel(gray,cv2.CV_64F,0,1,ksize=3)
solber_y=cv2.convertScaleAbs(solber_y)
cv2.imshow('solber_y',solber_y)
cv2.waitKey(0)
solber_xy=cv2.addWeighted(solber_x,1,solber_y,1,0)
cv2.imshow('solber_xy',solber_xy)
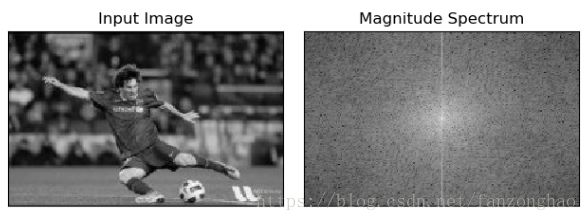
cv2.waitKey(0)五,傅里叶变换用来分析各种滤波器的频率特性,图片中的边缘点和噪声可看成是高频分量,因为变化明显,没有很大变化的就看成低频分量
https://docs.opencv.org/master/de/dbc/tutorial_py_fourier_transform.html
"""
傅利叶变换
"""
def FFT():
    img = cv2.imread('./data/img3.png', 0)
    f = np.fft.fft2(img)
    fshift = np.fft.fftshift(f)
    magnitude_spectrum = 20 * np.log(np.abs(fshift))
    plt.subplot(121), plt.imshow(img, cmap='gray')
    plt.title('Input Image'), plt.xticks([]), plt.yticks([])
    plt.subplot(122), plt.imshow(magnitude_spectrum, cmap='gray')
    plt.title('Magnitude Spectrum'), plt.xticks([]), plt.yticks([])
    plt.show()
在中间部分更亮,表明低频分量多
用60×60窗口去掉低频分量
def FFT():
    img = cv2.imread('./data/img3.png', 0)
    f = np.fft.fft2(img)
    fshift = np.fft.fftshift(f)
    # magnitude_spectrum = 20 * np.log(np.abs(fshift))
    # plt.subplot(121), plt.imshow(img, cmap='gray')
    # plt.title('Input Image'), plt.xticks([]), plt.yticks([])
    # plt.subplot(122), plt.imshow(magnitude_spectrum, cmap='gray')
    # plt.title('Magnitude Spectrum'), plt.xticks([]), plt.yticks([])
    # plt.show()

    rows, cols = img.shape
    crow, ccol = int(rows / 2), int(cols / 2)
    fshift[crow - 30:crow + 30, ccol - 30:ccol + 30] = 0
    f_ishift = np.fft.ifftshift(fshift)
    img_back = np.fft.ifft2(f_ishift)
    img_back = np.abs(img_back)
    plt.subplot(131), plt.imshow(img, cmap='gray')
    plt.title('Input Image'), plt.xticks([]), plt.yticks([])
    plt.subplot(132), plt.imshow(img_back, cmap='gray')
    plt.title('Image after HPF'), plt.xticks([]), plt.yticks([])
    plt.subplot(133), plt.imshow(img_back)
    plt.title('Result in JET'), plt.xticks([]), plt.yticks([])
    plt.show()
可见只保留了人的边缘信息,证明了中间亮的那些部分是低频分量。
六,Laplacian为啥是高通滤波器
def laplace_high_pass():
    # simple averaging filter without scaling parameter
    mean_filter = np.ones((3,3))
    # creating a gaussian filter
    x = cv2.getGaussianKernel(5,10)
    gaussian = x*x.T
    # different edge detecting filters
    # scharr in x-direction
    scharr = np.array([[-3, 0, 3],
                       [-10,0,10],
                       [-3, 0, 3]])
    # sobel in x direction
    sobel_x= np.array([[-1, 0, 1],
                       [-2, 0, 2],
                       [-1, 0, 1]])
    # sobel in y direction
    sobel_y= np.array([[-1,-2,-1],
                       [0, 0, 0],
                       [1, 2, 1]])
    # laplacian
    laplacian=np.array([[0, 1, 0],
                        [1,-4, 1],
                        [0, 1, 0]])
    filters = [mean_filter, gaussian, laplacian, sobel_x, sobel_y, scharr]
    filter_name = ['mean_filter', 'gaussian','laplacian', 'sobel_x', \
                    'sobel_y', 'scharr_x']
    fft_filters = [np.fft.fft2(x) for x in filters]
    fft_shift = [np.fft.fftshift(y) for y in fft_filters]
    mag_spectrum = [np.log(np.abs(z)+1) for z in fft_shift]
    for i in range(6):
        plt.subplot(2,3,i+1),plt.imshow(mag_spectrum[i],cmap = 'gray')
        plt.title(filter_name[i]), plt.xticks([]), plt.yticks([])
    plt.show()
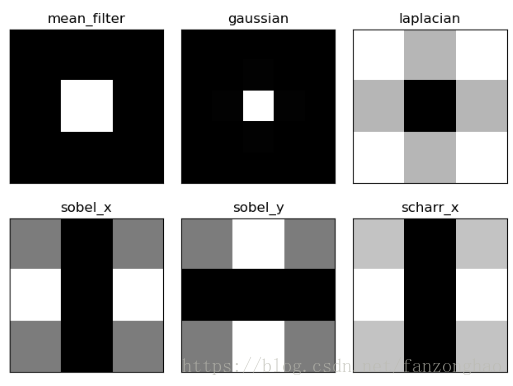
打印结果:
中间有白色的部分代表是低通滤波器,中间有黑色的部分代表是高通滤波器。
七,图像锐化
图像的边缘信息在图像风险和人的视觉中都是非常重要的,物体的边缘是以图像局部特性不连续的形式出现的。前面介绍的图像滤波对于消除噪声是有益的,但往往使图像中的边界、轮廓变的模糊,为了减少这类不利效果的影响,就需要利用图像锐化技术,使图像的边缘变得更加鲜明。图像锐化处理的目的就是为了使图像的边缘、轮廓线以及图像的细节变得清晰,经过平滑处理后的图像变得模糊的根本原因是因为图像的像素受到了平均或积分,因此对其进行逆运算(如微分运算)就可以使图像变得清晰。从频率域来考虑,图像模糊的实质是因为其高频分量被衰减,因此可以用高通滤波器使图像清晰。
八.例子 提取条形码
1.1 利用梯度操作是如何检测出图片的条形码;
1.2 利用均值滤波作用于梯度图片,平滑图片中的高频噪声;
1.3 二值化;
1.4 利用函数cv2.getStructuringElement构造一个矩形核做闭运算,这个核的宽度大于高度,因此允许我们缩小条形码垂直条带之间的间隙;
1.5 腐蚀,膨胀去掉大部分独立斑点;
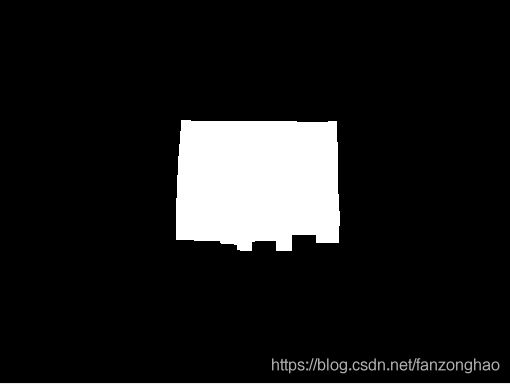
1.6 找出最大轮廓,提取。
import cv2
import matplotlib.pyplot as plt
import numpy as np
import imutils
path='./barcode.png'
image = cv2.imread(path)
image_h, image_w,_=image.shape
print('======opencv read data type========')
print(image.dtype)
gray = cv2.cvtColor(image, cv2.COLOR_BGR2GRAY)

# # 计算图片x和y方向的Scharr梯度大小
ddepth = cv2.CV_32F if imutils.is_cv2() else cv2.CV_32F
gradX = cv2.Sobel(gray, ddepth=ddepth , dx=1, dy=0, ksize=-1)
print('gradX.dtype:',gradX.dtype)

# # #debug
# gradX = cv2.convertScaleAbs(gradX)
# print(gradX.dtype)
# cv2.imshow('gradX',gradX)
# cv2.waitKey(0)

gradY = cv2.Sobel(gray, ddepth=ddepth , dx=0, dy=1, ksize=-1)
# # #debug
# gradY = cv2.convertScaleAbs(gradY)
# print(gradY.dtype)
# cv2.imshow('gradY',gradY)
# cv2.waitKey(0)

# 用x方向的梯度减去y方向的梯度
gradient = cv2.subtract(gradX,gradY)
# cv2.imshow('gradient1',gradient)
# cv2.waitKey(0)

#转回uint8
gradient = cv2.convertScaleAbs(gradient)
# print(gradient.shape)
# print(gradient.dtype)
# cv2.imshow('gradient2',gradient)
# cv2.waitKey(0)

# blur and threshold the image
blurred = cv2.blur(gradient, (9, 9))
thresh= cv2.threshold(blurred, 225, 255, cv2.THRESH_BINARY)[1]

# cv2.imshow('thresh:',thresh)
# cv2.waitKey(0)
# construct a closing kernel and apply it to the thresholded image
kernel = cv2.getStructuringElement(cv2.MORPH_RECT, (21, 7))
closed = cv2.morphologyEx(thresh, cv2.MORPH_CLOSE, kernel)
# cv2.imshow('closed:',closed)
# cv2.waitKey(0)
# perform a series of erosions and dilations
closed = cv2.erode(closed, None, iterations = 4)
closed = cv2.dilate(closed, None, iterations = 4)
# cv2.imshow('close:',closed)
# cv2.waitKey(0)

# find the contours in the thresholded image, then sort the contours
# by their area, keeping only the largest one
cnts = cv2.findContours(closed.copy(), cv2.RETR_EXTERNAL, cv2.CHAIN_APPROX_SIMPLE)
cnts = imutils.grab_contours(cnts)
# cnts = cnts[0]
c = sorted(cnts, key=cv2.contourArea, reverse=True)
c = np.squeeze(c[0])
# plt.plot(c[:, 0], c[:, 1])
# plt.show()
mask = np.zeros((image_h, image_w, 3))
dummy_mask = cv2.drawContours(mask, [c], 0, (255, 255, 255), thickness=cv2.FILLED)
cv2.imshow('dummy_mask',dummy_mask)
cv2.waitKey(0)

image_bar=(image*(np.array(dummy_mask/255).astype(np.uint8)))
cv2.imshow('image_bar',image_bar)
cv2.waitKey(0)
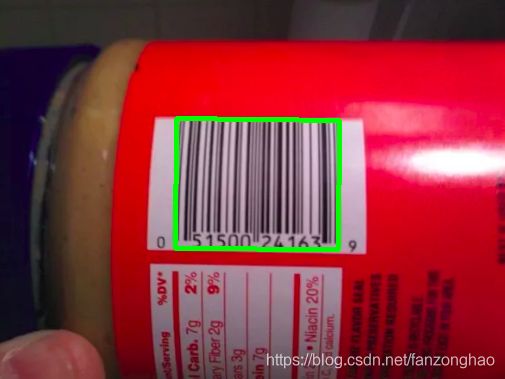
用下面这个是提取出轮廓的外接多边形然后框出来
rect=cv2.minAreaRect(c)#get center xy and w h
box = cv2.boxPoints(rect) # cv2.boxPoints(rect) for OpenCV 3.x 获取最小外接矩形的4个顶点坐标
box = np.int0(box)
print(box)
cv2.drawContours(image, [box], 0, (0, 255, 0), 3)

cv2.imshow('image',image)
cv2.waitKey(0)
2.1 解析二维码
import pyzbar.pyzbar as pyzbar

img = cv2.imread('./2.png')

gray = cv2.cvtColor(img, cv2.COLOR_BGR2GRAY)
gray_h, gray_w = gray.shape
barcodes = pyzbar.decode(gray)
print('==barcodes:', barcodes)

def parse_results(barcode):
    # for barcode in barcodes:
    # 提取二维码的位置
    (x, y, w, h) = barcode.rect
    # 字符串转换
    barcodeData = barcode.data.decode("utf-8")
    # barcodeType = barcode.type

    return x, y, x + w, y + h, barcodeData

if len(barcodes):
    print('==barcodes[0]:', barcodes[0])
    x1, y1, x2, y2, barcodeData = parse_results(barcodes[0])
    print('==barcodeData:', barcodeData)
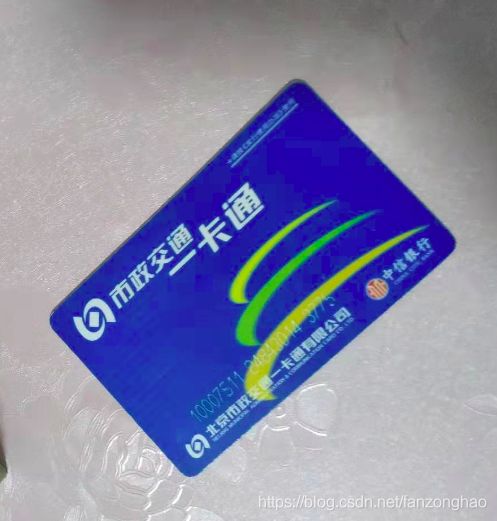
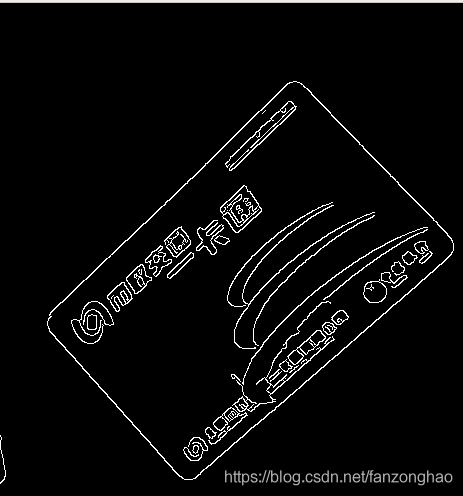
九.倾斜矫正
#from imutils.perspective import four_point_transform
#import imutils
import cv2
import numpy as np
from matplotlib import pyplot as plt
import math


def Get_Outline(input_dir):
    image = cv2.imread(input_dir)
    gray = cv2.cvtColor(image, cv2.COLOR_BGR2GRAY)
    blurred = cv2.GaussianBlur(gray, (5, 5), 0)
    edged = cv2.Canny(blurred, 75, 200)
    return image, gray, edged


def Get_cnt(edged):
    cnts = cv2.findContours(edged.copy(), cv2.RETR_EXTERNAL, cv2.CHAIN_APPROX_SIMPLE)

    cnts = cnts[0]  # if imutils.is_cv2() else cnts[1]

    docCnt = None

    if len(cnts) > 0:
        cnts = sorted(cnts, key=cv2.contourArea, reverse=True)
        for c in cnts:
            peri = cv2.arcLength(c, True)  # 轮廓按大小降序排序
            approx = cv2.approxPolyDP(c, 0.02 * peri, True)  # 获取近似的轮廓
            if len(approx) == 4:  # 近似轮廓有四个顶点
                docCnt = approx
                break

    return docCnt


def calculate_distance(point1, point2):
    d_x = point1[0] - point2[0]
    d_y = point1[1] - point2[1]
    distance = math.sqrt(d_x ** 2 + d_y ** 2)
    return distance


if __name__ == "__main__":
    input_dir = "gongjiaoka.png"
    image, gray, edged = Get_Outline(input_dir)
    docCnt = Get_cnt(edged)
    # print(docCnt)

    print(docCnt.reshape(4, 2))
    # result_img = four_point_transform(image, docCnt.reshape(4,2)) # 对原始图像进行四点透视变换
    # 改变变换的模式 公交卡的比例是16:9
    pts1 = np.float32(docCnt.reshape(4, 2))
    # 加入一个判断,对不同宽高采用不同的系数
    p = docCnt.reshape(4, 2)
    # plt.plot(p[:,0],p[:,1])
    # plt.show()

    # 确定长短边
    if calculate_distance(p[0], p[1]) < calculate_distance(p[0], p[3]):
        pts2 = np.float32([[0, 0], [0, 180], [320, 180], [320, 0]])
        M = cv2.getPerspectiveTransform(pts1, pts2)
        #求仿射变换矩阵
        edged_rotate = cv2.warpPerspective(edged, M, (320, 180))
        image_rotate = cv2.warpPerspective(image, M, (320, 180))


    else:
        pts2 = np.float32([[0, 0], [0, 320], [180, 320], [180, 0]])
        #求仿射变换矩阵
        M = cv2.getPerspectiveTransform(pts1, pts2)
        edged_rotate = cv2.warpPerspective(edged, M, (180, 320))
        image_rotate = cv2.warpPerspective(image, M, (180, 320))

    cv2.imwrite('image_rotate.png',image_rotate)
    # print(result_img.shape)
    # -------画点----------
    for point in docCnt.reshape(4, 2):
        cv2.circle(image, tuple(point), 3, (0, 0, 255), 2)
    # # --------------
    cv2.imshow("original", image)
    # cv2.imshow("gray", gray)
    cv2.imshow("edged", edged)
    cv2.imshow("edged_rotate", edged_rotate)
    cv2.imshow("result_img", image_rotate)
    cv2.waitKey(0)
    cv2.destroyAllWindows()
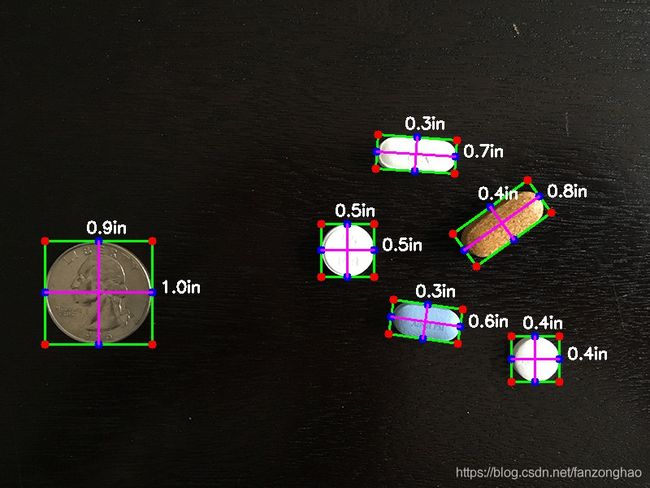
十.求物体尺寸
from scipy.spatial import distance as dist
from imutils import perspective
from imutils import contours
import numpy as np
import argparse
import imutils
import cv2

def midpoint(ptA, ptB):
	return ((ptA[0] + ptB[0]) * 0.5, (ptA[1] + ptB[1]) * 0.5)

path='./img/example_02.png'
#硬币长度0.955inch
WIDTH=0.955
# load the image, convert it to grayscale, and blur it slightly
image = cv2.imread(path)
gray = cv2.cvtColor(image, cv2.COLOR_BGR2GRAY)
gray = cv2.GaussianBlur(gray, (7, 7), 0)

# cv2.imwrite('gray.jpg',gray)

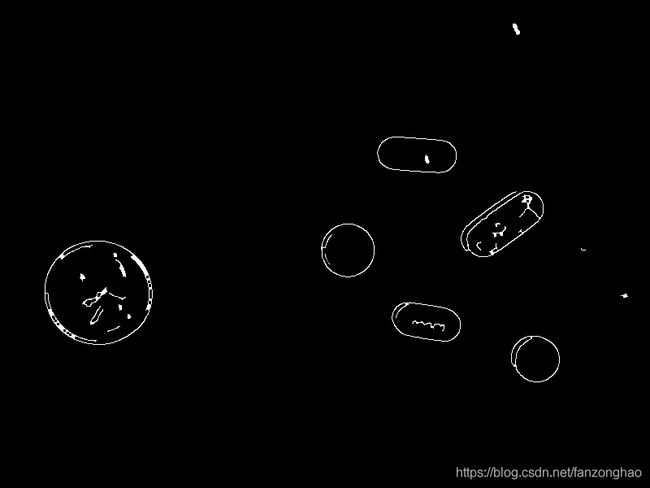
edged = cv2.Canny(gray, 50, 100)
edged = cv2.dilate(edged, None, iterations=1)
edged = cv2.erode(edged, None, iterations=1)

# find contours in the edge map
cnts = cv2.findContours(edged.copy(), cv2.RETR_EXTERNAL, cv2.CHAIN_APPROX_SIMPLE)
cnts = cnts[0] if imutils.is_cv2() else cnts[1]
cnts = sorted(cnts, key=cv2.contourArea, reverse=True)
# print(len(cnts))
# print(cnts[0].shape)
pixelsPerMetric = None
orig = image.copy()

for c in cnts:
	if cv2.contourArea(c) < 100:
		continue

	box = cv2.minAreaRect(c)
	box = cv2.cv.BoxPoints(box) if imutils.is_cv2() else cv2.boxPoints(box)
	box = np.array(box, dtype="int")
	print('box:',box)
	box = perspective.order_points(box)
	cv2.drawContours(orig, [box.astype("int")], -1, (0, 255, 0), 2)

	for (x, y) in box:
		cv2.circle(orig, (int(x), int(y)), 5, (0, 0, 255), -1)

	(tl, tr, br, bl) = box
	(tltrX, tltrY) = midpoint(tl, tr)
	(blbrX, blbrY) = midpoint(bl, br)

	(tlblX, tlblY) = midpoint(tl, bl)
	(trbrX, trbrY) = midpoint(tr, br)

	# draw the midpoints on the image
	cv2.circle(orig, (int(tltrX), int(tltrY)), 5, (255, 0, 0), -1)
	cv2.circle(orig, (int(blbrX), int(blbrY)), 5, (255, 0, 0), -1)
	cv2.circle(orig, (int(tlblX), int(tlblY)), 5, (255, 0, 0), -1)
	cv2.circle(orig, (int(trbrX), int(trbrY)), 5, (255, 0, 0), -1)

	# draw lines between the midpoints
	cv2.line(orig, (int(tltrX), int(tltrY)), (int(blbrX), int(blbrY)),
		(255, 0, 255), 2)
	cv2.line(orig, (int(tlblX), int(tlblY)), (int(trbrX), int(trbrY)),
		(255, 0, 255), 2)

	# compute the Euclidean distance between the midpoints
	dA = dist.euclidean((tltrX, tltrY), (blbrX, blbrY))
	dB = dist.euclidean((tlblX, tlblY), (trbrX, trbrY))

	# if the pixels per metric has not been initialized, then
	# compute it as the ratio of pixels to supplied metric
	# (in this case, inches)
	if pixelsPerMetric is None:
		pixelsPerMetric = dB / WIDTH

	# compute the size of the object
	dimA = dA / pixelsPerMetric
	dimB = dB / pixelsPerMetric

	# draw the object sizes on the image
	cv2.putText(orig, "{:.1f}in".format(dimA),
		(int(tltrX - 15), int(tltrY - 10)), cv2.FONT_HERSHEY_SIMPLEX,
		0.65, (255, 255, 255), 2)
	cv2.putText(orig, "{:.1f}in".format(dimB),
		(int(trbrX + 10), int(trbrY)), cv2.FONT_HERSHEY_SIMPLEX,
		0.65, (255, 255, 255), 2)
cv2.imwrite('orig.jpg', orig)