Transcription dynamics during human erythroid differentiation and development
人类红系分化发育过程中的转录动力学
Abstract
Methods:
What the writers analyzed is the genome-wide transcription dynamics occurring during the differentiation of human embryonic stem cells(HESCs) into the erythroid lineage and development of embryonic to adult erythropoiesis using high throughput sequencing technology, since they wanted to explore the mechanisms controlling erythroid differentiation and development.
人通过高通量测序技术分析人类胚胎干细胞进入红系分化体系以及胚胎发育到成红细胞的过程中发生的全基因组转录动态性,因为作者们想要探索调控红系分化和发育的机制。
Materials:
HESCs and erythroid cells at three developmental stages: ESER( embryonic) ,FLER(fetal), and PBER(adult) were collected and sequenced.
人类胚胎干细胞和胚胎细胞的三个阶段:胚胎细胞,胎肝细胞和成红细胞。
Results:
The number of expressed genes decreased during differentiation, whereas the total expression intensity increased.
表达基因的数据在分化期间变少,然而总的表达强度在加深。
At each of the three transitions (HESCs-ESERs, ESERs-FLERs, and FLERs-PBERs), many differentially expressed genes were observed, which were involved in maintaining pluripotency, early erythroid specification, rapid cell growth, and cell-cell adhesion and interaction.
在这三个转录中的每一个转录期间,许多差异表达基因被观测到,他们涉及维持多能性,早起红系特定性,细胞快速增长,细胞间的黏糊性和交互性。
Dynamic networks and their central nodes in each transitions.
每一转录期的动力学网络和他们的中心调控(基因)结点。
Results:
1.RNA-seq of HESCs and erythroid cells of different development stages.
不同分化时期的人类胚胎功能干细胞和红细胞的RNA-seq。
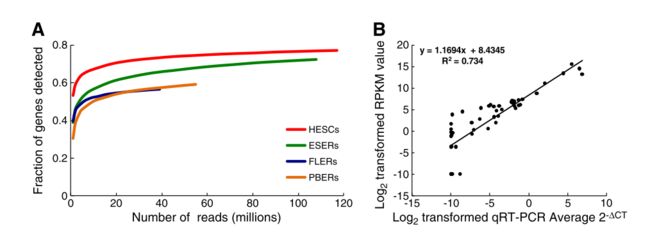
Quality analysis of RNA-seq data.
RNA-seq 的测序质量。
(A) Fraction of genes detected as a function of read depth.
检测到的基因分数与读取深度的关系。
X-axis: number of reads(millions) mapped to the genome;
X-轴 : 映射到基因组的读数(百万)个数;
Y-axis: the proportion of genes detected in genes from the National Center for Biotechnology Information(NCBI) database.
Y-轴: 从国家生物技术中心(NCBI) 数据库获取的基因中检测到的基因比例
(B) Correlation between qRT-PCR and RNA-Seq for selected genes in HESCs, ESERs, FLERs, and PBERs. The selected genes are FOXO1, SOX4, TET1, BLVRA, CAT, TXNIP, HBE, HBG1, GATA1, and KLF1.
(B)选择的基因 的aRT-PCR与RNA-seq的相关关系。选中的基因为: FOXO1, SOX4, TET1, BLVRA, CAT, TXNIP, HBE, HBG1, GATA1, and KLF1.
2.Distinct gene expression patterns during differentiation and development.不同分化与发育阶段的基因表达模式。
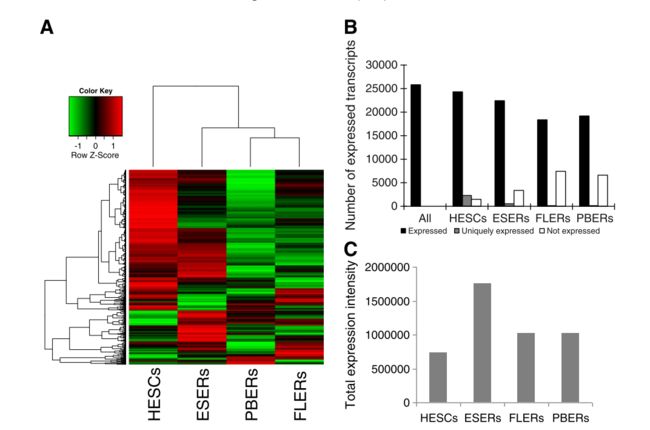
Gene expression dynamics during differentiation.
分化中基因表达的动态性。
(A)Hierarchical clustering of genes expressed in HESC, ESER, FLER, and PBER cells. Each row prepresents a gene, and each column represents a cell type at different stages. 在HESC, ESER, FLER, 和PBER细胞中表达基因的分层聚类。 每一行代表一个基因, 每一列代表一种在不同阶段的细胞。
Expression intensites are displayed from green(low expression) to red(high expression).Lines on the top and left represent the similarity between cell types and genes, repectivley.
表达强度被展示为绿色(低表达)到红色(高表达)。在顶端和低端的直线代表各自代表细胞间和基因间的相似性。
Genes and cell types with the most similar expression profiles were clusterd together withe the shortest branches and represented in the dendrogram to illustrate their relationship.
有着高度相似性的基因和细胞被最短的分支线聚类在一起,用树形图去解析了他们之间的关系。
(B) Numbers of genes expressed in four cell types. All: genes expressed in at least one of the four cell types;not expressed: absent relative to "all" ; uniquely expressed: expressed only in one cell type. 在四种细胞中基因表达的数量,所有:表示至少在四种中的一种细胞中表达, 不表达: 表示在 all 中相对不存在表达的基因,独特表达:表示只在一种细胞类型中表达。
(C) The total expression intensity of genes in four cell types. X-axis: four kinds of cell types,Y-axis: the expression intensity of all genes.
在四种细胞中基因的总表达强度。
3.Differentiatial expression of unique class of genes in eythroid defferentiation and development.
在红系分化和发育中差异表达基因中的独特基因类。
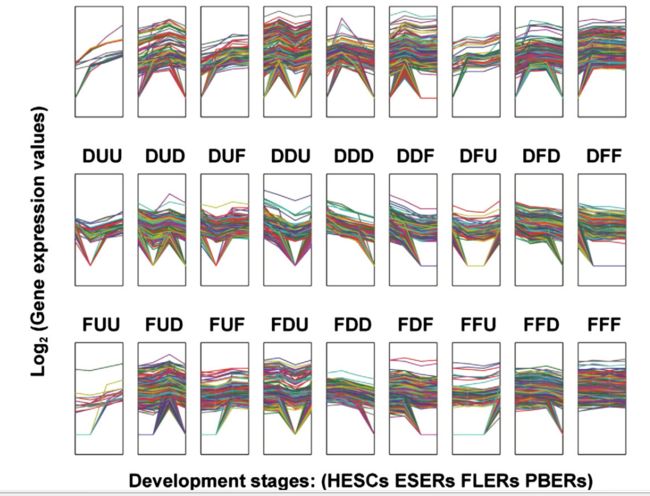
Quantification of dynamic transcriptome changes during erythroid differentiation.
红细胞分化过程中动态转录组变化的定量分析
According to gene expression intensity, 27 patterns were identified.
根据基因表达强度,2中表达模型被鉴定出。
Captial letters represent the three transcriptome changes during erythroid differentiation and development, e.g, the first letter represents changes from HESCs to ESERs, the seceond one represents changes from ESERs to FLERs, and the third one represents changes from FLERs to PBERs(U, up-regulated; D,down-regulated; and F, flat or unchanged).
大写字母代表在红系分化和发育的三个转录期的改变,例如,一个个字母代表 HESc到ESERs转录期的改变。第二个代表 ESERs到FLERs的改变,第三个代表FLERs 到PBERs 的改变。 (U: 上调,D: 下调, F, 平稳,未改变)
Each line represnets the gene expression dynamics. We thank Wu JQ et al. for the model.
每一行代表基因表达的动力学
- Identification of gene regulatory networks and central nodes involved in erythroid differentiation and development.
鉴定基因调控的网络和参与红系分化与发育的中心节点。
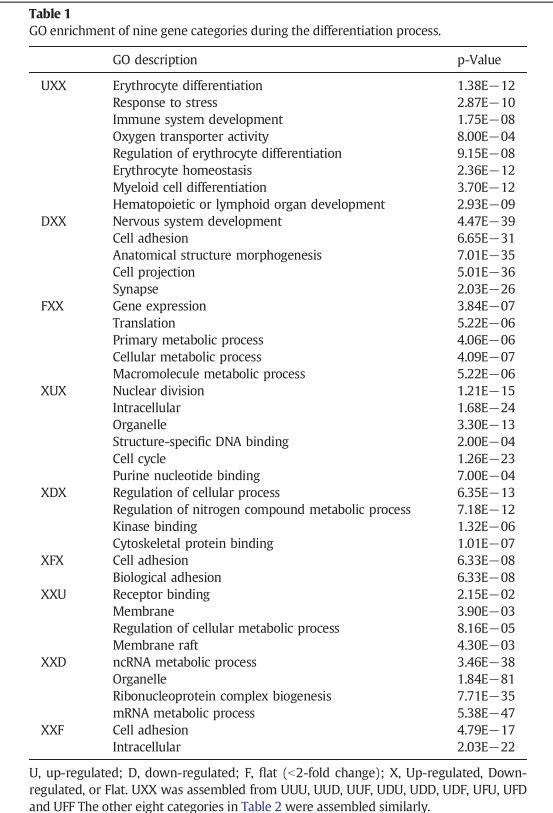
GO enrichment of nine gene categories during the differentiation process.
在分化过程中九种基因类别的GO富集
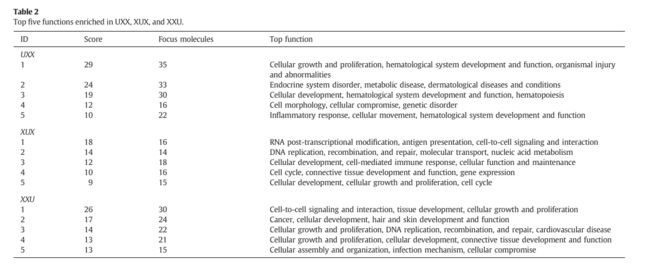
Top five functions enriched in UXX, XUX,and XXU.
在UXX, XUX, XXU, 阶段中前5个被富集的功能。
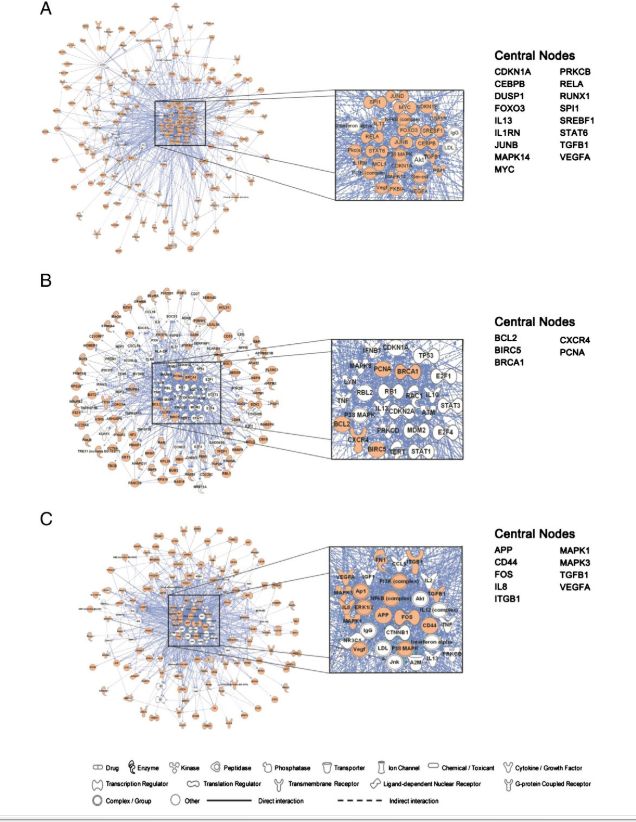
Gene networks and central nodes involved in erythroid differentiation and development.
涉及红系分化发育的调控网络以及中心节点
Genes involved in the three stages transitions were analyzed using Ingenuity Pathway Analysis(IPA)
涉及三个阶段转录期的基因用IPA来分析
Orange gene symbols indicate genes that appeared in UXX, XUX, or XXU. White gene symbols indicate gnes not identified in UXX, XUX, or XXU. Genes with a score >2 fold the average score of the network are defined as central nodes.
橙色的基因节点被显示为出现在UXX, XUX, 或XXU时期,白色的表示为出现在这三种时期的, 基因表达量大于平均表达表达2倍的被认为是中心节点。
(A) A gene network of 17 central nodes constructed using up-regulated in ESERs compared with HESCs(UXX).
在UXX时期,即与HESCs相比, ESER时期的上调基因调控网络和17个中心节点。
(B) Network analysis of up-regulated genes in FLERs Vs ESERs, with 5 central nodes(XUX).
XUX 时期,即与ESERs相比,FLERs 上调基因的调控网络。
(C) A gene network constructed using genes up-regulated in PBERs vs. FLERs, with 9 cenral nodes(XXU).
XXU, FLERs与PBERs相比的上台基因的的调控网络以及9个中心节点。
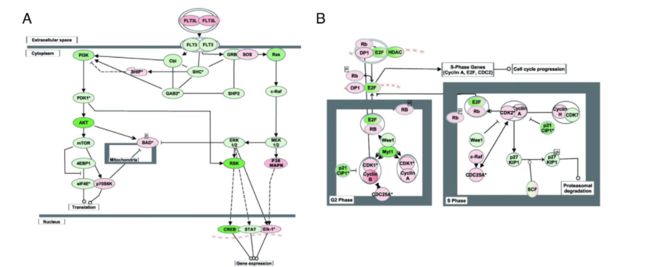
Pathways activated in each comparision.在每个比较转录时期中被激活的通路。
Pathways activated in the three stage.Pathways activated in the three stage transitions containing central nodes were identified by IPA.
在三个阶段被激活的通路,用IPA识别在这三个转录期中包含中心节点被激活的通路。
(A) Activation of the FLTS3 signaling pathway in ESER in ESER cells compared with that in HESCs.
相比HESCs, 在ESERs细胞中, FLTS3 信号通路被激活。
(B) Activation of cyclins and cell cycle regulation pathway in FLER cells compared with that in ESER cells.
与ESER 细胞相比,在FLER细胞中, 细胞周期蛋白和细胞周期调控被激活。
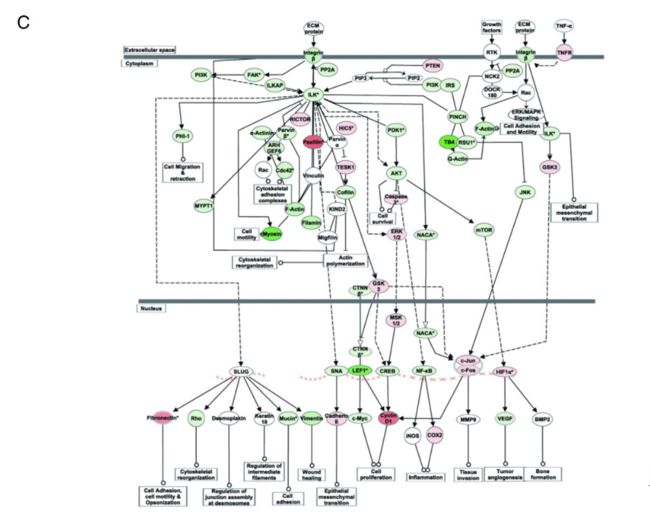
(C) Activation of ILK signaling pathway in PBER cells compared with that in FLER cells.
与FLER细胞相比,在 PBER细胞中,ILK信号通路被激活。
Red and green represent up-regulated and donw-regulated genes, respectively. The extent of regulation is based on the color grade. Symbols with gradient colors indicate a gene family whose members change in different degree.
红色和绿色各自代表上调和下调。调控程度取决于颜色等级。有着颜色等级的基因符号代表基因家族成员在不同程度上的改变。
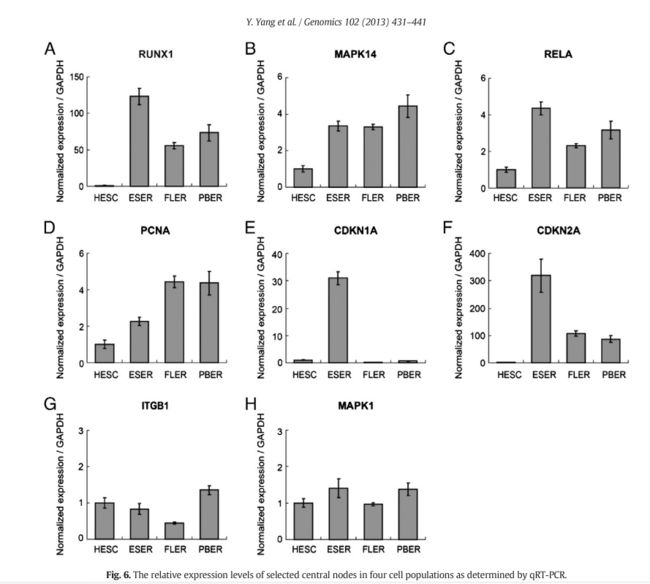
The relative expression levels of selected central nodes in four cell populations as determined by qRT-PCR.
用qRT-PCR测定选中的中心节点在四种细胞群中的相对表达程度。