Compiled: March 18, 2021
Source: vignettes/integration_introduction.Rmd
教程来源:https://satijalab.org/seurat/articles/integration_introduction.html
两个或多个单细胞数据集的联合分析具有独特的挑战。特别是,在标准工作流程下,识别跨多个数据集存在的细胞群可能会有问题。Seurat v4包含一组方法,用于跨数据集匹配(或“对齐”)共享的细胞群。这些方法首先识别处于匹配生物状态的交叉数据集细胞(“锚”),可以用于纠正数据集之间的技术差异(即批效应校正),并在不同实验条件下执行比较scRNA-seq分析。
下面,我们使用了两种不同state(a resting or interferon-stimulated state)的人类PBMC细胞进行了比较分析。方法详细描述见: Stuart, Butler et al, 2019
整合目标:
接下来的教程,你使用Seurat整合程序可以了解一个复杂细胞类型的比较分析的概览。
- 对于下游分析创建一个整合的assay
- 鉴定两个数据集中都有的细胞类型
- 获取在control和stimulated细胞中都保守的cell markers
- 比较两个数据集来发现对于stimulated有响应的特异细胞类型
1.设置Seurat对象
为了方便,我们将本次使用的数据封装在SeuratData包中。
# 加载包
library(Seurat)
library(SeuratData)
library(patchwork)

# install dataset
InstallData("ifnb")
加载数据,然后创建对象
# load dataset
ifnb <- LoadData("ifnb")

# split the dataset into a list of two seurat objects (stim and CTRL)
ifnb.list <- SplitObject(ifnb, split.by = "stim")

# normalize and identify variable features for each dataset independently
ifnb.list <- lapply(X = ifnb.list, FUN = function(x) {
    x <- NormalizeData(x)
    x <- FindVariableFeatures(x, selection.method = "vst", nfeatures = 2000)
})

# 可以看到ifnb.list包含了两个Seurat对象:CTRL和STIM
ifnb.list
$CTRL
An object of class Seurat
14053 features across 6548 samples within 1 assay
Active assay: RNA (14053 features, 2000 variable features)

$STIM
An object of class Seurat
14053 features across 7451 samples within 1 assay
Active assay: RNA (14053 features, 2000 variable features)


# select features that are repeatedly variable across datasets for integration
features <- SelectIntegrationFeatures(object.list = ifnb.list)
head(features)
[1] "HBB"  "HBA2" "HBA1" "CCL4" "CCL3" "CCL7"
2.进行整合
FindIntegrationAnchors()函数使用Seurat对象列表作为输入,来识别anchors。然后使用IntegrateData()函数用识别到的anchors来整合数据集。
immune.anchors <- FindIntegrationAnchors(object.list = ifnb.list, anchor.features = features)

# this command creates an 'integrated' data assay
immune.combined <- IntegrateData(anchorset = immune.anchors)
3.整合分析
现在,我们可以对所有细胞进行整合分析了
# specify that we will perform downstream analysis on the corrected data note that the original
# unmodified data still resides in the 'RNA' assay
DefaultAssay(immune.combined) <- "integrated"

# Run the standard workflow for visualization and clustering
immune.combined <- ScaleData(immune.combined, verbose = FALSE)
immune.combined <- RunPCA(immune.combined, npcs = 30, verbose = FALSE)
immune.combined <- RunUMAP(immune.combined, reduction = "pca", dims = 1:30)
immune.combined <- FindNeighbors(immune.combined, reduction = "pca", dims = 1:30)
immune.combined <- FindClusters(immune.combined, resolution = 0.5)
可视化
# Visualization
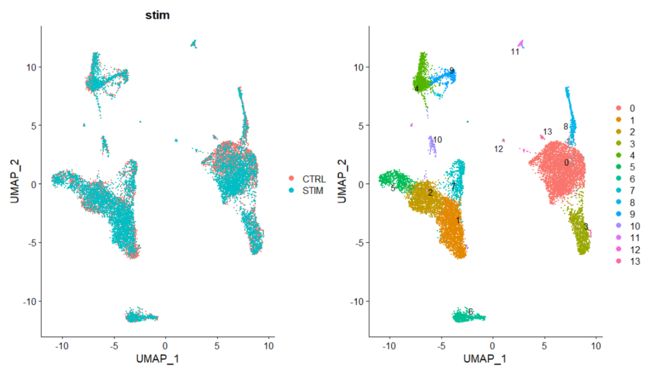
p1 <- DimPlot(immune.combined, reduction = "umap", group.by = "stim")
p2 <- DimPlot(immune.combined, reduction = "umap", label = TRUE, repel = TRUE)
p1 + p2
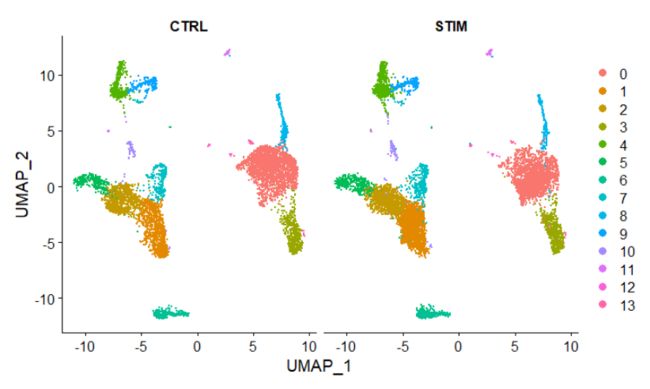
可以使用split.by展示两个condition下的UMAP图
DimPlot(immune.combined, reduction = "umap", split.by = "stim")
4.识别保守的细胞类型markers
为了识别在不同condition下的经典的保守的细胞类型markers,使用FindConservedMarkers()函数。这个函数对每个group/dataset进行差异表达分析,然后使用MetaDE对p值进行合并。
下面,我们来识别 cluster 6 (NK cells)的保守markers。
# For performing differential expression after integration, we switch back to the original data
DefaultAssay(immune.combined) <- "RNA"
nk.markers <- FindConservedMarkers(immune.combined, ident.1 = 6, grouping.var = "stim", verbose = FALSE)
head(nk.markers)
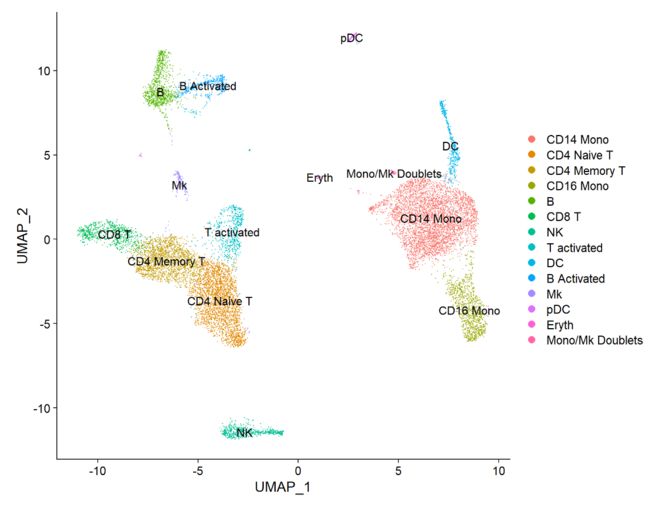
我们可以探索这些基因,然后帮助我们注释细胞类型。
FeaturePlot(immune.combined, features = c("CD3D", "SELL", "CREM", "CD8A", "GNLY", "CD79A", "FCGR3A", "CCL2", "PPBP"), min.cutoff = "q9")
immune.combined <- RenameIdents(immune.combined,
                                `0` = "CD14 Mono",
                                `1` = "CD4 Naive T",
                                `2` = "CD4 Memory T",
                                `3` = "CD16 Mono",
                                `4` = "B",
                                `5` = "CD8 T",
                                `6` = "NK",
                                `7` = "T activated",
                                `8` = "DC",
                                `9` = "B Activated",
                                `10` = "Mk",
                                `11` = "pDC",
                                `12` = "Eryth",
                                `13` = "Mono/Mk Doublets",
                                #`14` = "HSPC")
DimPlot(immune.combined, label = TRUE)
DotPlot()函数的split.by参数可以在不同条件下查看保守的细胞类型标记,显示表达水平和细胞在一个簇中表达任何给定基因的百分比。在这里,我们为我们的13个集群中的每一个绘制了2-3个强标记基因。
Idents(immune.combined) <- factor(Idents(immune.combined),
                                  levels = c("HSPC", "Mono/Mk Doublets", "pDC",
                                             "Eryth", "Mk", "DC", "CD14 Mono",
                                             "CD16 Mono", "B Activated", "B",
                                             "CD8 T", "NK", "T activated", "CD4 Naive T",
                                             "CD4 Memory T"))

markers.to.plot <- c("CD3D", "CREM", "HSPH1", "SELL", "GIMAP5", "CACYBP", "GNLY", "NKG7", "CCL5",
                     "CD8A", "MS4A1", "CD79A", "MIR155HG", "NME1", "FCGR3A", "VMO1", "CCL2", "S100A9", "HLA-DQA1",
                     "GPR183", "PPBP", "GNG11", "HBA2", "HBB", "TSPAN13", "IL3RA", "IGJ", "PRSS57")
DotPlot(immune.combined, features = markers.to.plot, cols = c("blue", "red"), dot.scale = 8, split.by = "stim") + RotatedAxis()
5.识别不同condition下的差异表达基因
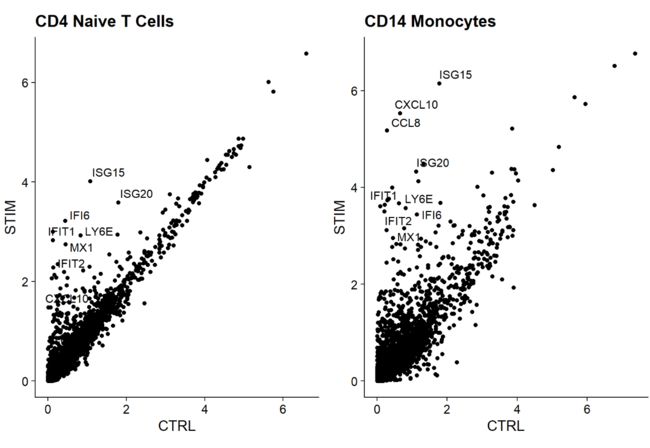
现在我们已经把受刺激细胞和控制细胞排列好了,我们可以开始做比较分析,看看刺激引起的差异。广泛观察这些变化的一种方法是绘制受刺激细胞和控制细胞的平均表达,并在散点图上寻找视觉异常的基因。在这里,我们取受刺激的和控制的naive T细胞和CD14单核细胞群的平均表达量,并生成散点图,突出显示对干扰素刺激有显著反应的基因。
library(ggplot2)
library(cowplot)
theme_set(theme_cowplot())
t.cells <- subset(immune.combined, idents = "CD4 Naive T")
Idents(t.cells) <- "stim"
avg.t.cells <- as.data.frame(log1p(AverageExpression(t.cells, verbose = FALSE)$RNA))
avg.t.cells$gene <- rownames(avg.t.cells)

cd14.mono <- subset(immune.combined, idents = "CD14 Mono")
Idents(cd14.mono) <- "stim"
avg.cd14.mono <- as.data.frame(log1p(AverageExpression(cd14.mono, verbose = FALSE)$RNA))
avg.cd14.mono$gene <- rownames(avg.cd14.mono)

genes.to.label = c("ISG15", "LY6E", "IFI6", "ISG20", "MX1", "IFIT2", "IFIT1", "CXCL10", "CCL8")
p1 <- ggplot(avg.t.cells, aes(CTRL, STIM)) + geom_point() + ggtitle("CD4 Naive T Cells")
p1 <- LabelPoints(plot = p1, points = genes.to.label, repel = TRUE)

p2 <- ggplot(avg.cd14.mono, aes(CTRL, STIM)) + geom_point() + ggtitle("CD14 Monocytes")
p2 <- LabelPoints(plot = p2, points = genes.to.label, repel = TRUE)
p1 + p2
上面的图中,也是作者事先就知道了在两个条件中差异表达的基因:genes.to.label = c("ISG15", "LY6E", "IFI6", "ISG20", "MX1", "IFIT2", "IFIT1", "CXCL10", "CCL8"),我们的话需要用另外的方法来得到这些基因。
如你所见,许多相同的基因在这两种细胞类型中都上调,可能代表了保守的干扰素反应途径。
因为我们有信心在不同的条件下识别出共同的细胞类型,我们可以问什么基因在同一类型的细胞的不同条件下发生改变。
immune.combined$celltype.stim <- paste(Idents(immune.combined), immune.combined$stim, sep = "_")
immune.combined$celltype <- Idents(immune.combined)
Idents(immune.combined) <- "celltype.stim"
b.interferon.response <- FindMarkers(immune.combined, ident.1 = "B_STIM", ident.2 = "B_CTRL", verbose = FALSE)

head(b.interferon.response, n = 15)
                p_val avg_log2FC pct.1 pct.2     p_val_adj
ISG15   8.657899e-156  4.5965018 0.998 0.240 1.216695e-151
IFIT3   3.536522e-151  4.5004998 0.964 0.052 4.969874e-147
IFI6    1.204612e-149  4.2335821 0.966 0.080 1.692841e-145
ISG20   9.370954e-147  2.9393901 1.000 0.672 1.316900e-142
IFIT1   8.181640e-138  4.1290319 0.912 0.032 1.149766e-133
MX1     1.445540e-121  3.2932564 0.907 0.115 2.031417e-117
LY6E    2.944234e-117  3.1187120 0.894 0.152 4.137531e-113
TNFSF10 2.273307e-110  3.7772611 0.792 0.025 3.194678e-106
IFIT2   1.676837e-106  3.6547696 0.786 0.035 2.356459e-102
B2M      3.500771e-95  0.6062999 1.000 1.000  4.919633e-91
PLSCR1   3.279290e-94  2.8249220 0.797 0.117  4.608387e-90
IRF7     1.475385e-92  2.5888616 0.838 0.190  2.073358e-88
CXCL10   1.350777e-82  5.2509496 0.641 0.010  1.898247e-78
UBE2L6   2.783283e-81  2.1427434 0.851 0.300  3.911348e-77
PSMB9    2.638374e-76  1.6367800 0.941 0.573  3.707707e-72
另外一个展示基因表达变化的方法是使用FeaturePlot()或VlnPlot(),使用split.by参数。比如:CD3D and GNLY是非常经典的T cells and NK/CD8 T cells的marker,他们不受刺激的影响,在STRIM和CTRL中表现出相似的表达模式。
在另外一方面,IFI6 and ISG15基因在所有细胞中都上调,是干扰素响应的核心基因。
最后,CD14 and CXCL10对干扰素响应表现出特异的细胞类型差异。在CD14 monocytes细胞中,受干扰素刺激后表达降低,而这可能导致监督分析框架中的错误分类,强调了整合分析的价值。
在干扰素刺激后,CXCL10在单核细胞和B细胞中明显上调,但在其他细胞类型中没有上调。
FeaturePlot(immune.combined, features = c("CD3D", "GNLY", "IFI6"), split.by = "stim", max.cutoff = 3, cols = c("grey", "red"))
plots <- VlnPlot(immune.combined, features = c("LYZ", "ISG15", "CXCL10"), split.by = "stim", group.by = "celltype", pt.size = 0, combine = FALSE)

wrap_plots(plots = plots, ncol = 1)
6.基于SCTransform标准化进行整合分析
在 Hafemeister and Satija, 2019中,我们介绍了一个对scRNA-seq进行标准化的改进方法,,sctransform。该方法主要基于正则化负二项回归(regularized negative binomial regression),避免了标准标准化工作流的一些陷阱,包括添加伪计数和对数转换。
详细细节参考:manuscript or our SCTransform vignette。
下面看看怎么使用sctransform标准化的方法来修改Seurat的整合工作流,主要有以下几个方面的不同:
- 使用SCTransform()而不是NormalizeData()标准化单个数据集合。
- 在sctransform中使用3,000 or more features来进入下游分析。
- PrepSCTIntegration()来识别锚点(anchors)
- 使用FindIntegrationAnchors()
, andIntegrateData()的时候设置normalization.method参数为SCT。 - 运行基于sctransform的工作流程时,包括整合,不需要运行ScaleData函数。
那么完整的工作六如下:
LoadData("ifnb")
ifnb.list <- SplitObject(ifnb, split.by = "stim")
ifnb.list <- lapply(X = ifnb.list, FUN = SCTransform)
features <- SelectIntegrationFeatures(object.list = ifnb.list, nfeatures = 3000)
ifnb.list <- PrepSCTIntegration(object.list = ifnb.list, anchor.features = features)
immune.anchors <- FindIntegrationAnchors(object.list = ifnb.list, normalization.method = "SCT", anchor.features = features)
immune.combined.sct <- IntegrateData(anchorset = immune.anchors, normalization.method = "SCT")
immune.combined.sct <- RunPCA(immune.combined.sct, verbose = FALSE)
immune.combined.sct <- RunUMAP(immune.combined.sct, reduction = "pca", dims = 1:30)
p1 <- DimPlot(immune.combined.sct, reduction = "umap", group.by = "stim")
p2 <- DimPlot(immune.combined.sct, reduction = "umap", group.by = "seurat_annotations", label = TRUE, repel = TRUE)
p1 + p2
到此数据就整合完了,后面可以接着前面的步骤进行细胞识别等分析。


