Echart能画非常强大的图表绘制工具,由 Apache 孵化器赞助孵化的项目。

折线图
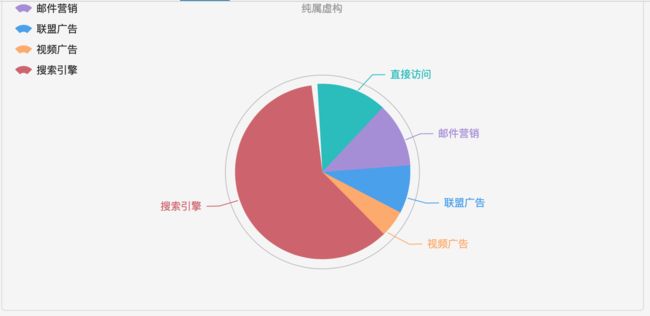
饼状图
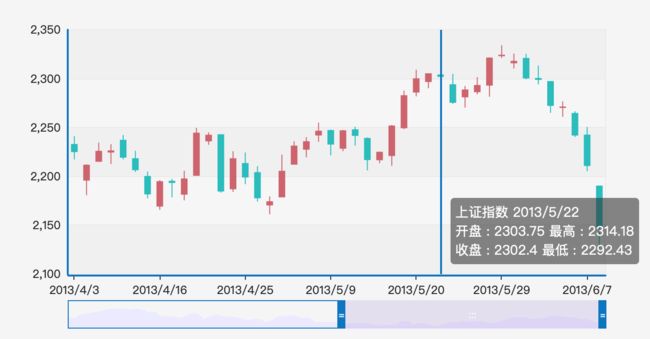
k线图
- 官方教程,内容非常全面。
-
创建项目
vue init webpack-simple echarts
npm install
npm run dev
-
安装eCharts
npm install echarts --save
-
echarts容器
-
初始化表格
const echarts = require('echarts');

methods: {
    getChart() {
      // 1. 获取表格容器
      var myChart = echarts.init(document.getElementById("echartContainer"));
      // 2. 设置各组件样式
      myChart.setOption({
        //表头
        title: {text: '柱状图表'},
        // 工具箱
        toolbox: {
          show: true,
          feature: {
            magicType: {show: true, type: ['stack', 'tiled']},
            saveAsImage: {show: true}
          }
        },
        // x轴
        xAxis: {
          type: 'category',
          boundaryGap: false,
          data: ['周一', '周二', '周三', '周四', '周五', '周六', '周日']
        },
        // y轴
        yAxis: {
          type: 'value'
        },

        // 展示数据
        series: [{
          name: '成交',
          type: 'line',
          smooth: true,
          data: [10, 12, 21, 54, 260, 830, 710]
        },
          {
            name: '预购',
            type: 'line',
            smooth: true,
            data: [30, 182, 434, 791, 390, 30, 10]
          },
          {
            name: '意向',
            type: 'line',
            smooth: true,
            data: [1320, 1132, 601, 234, 120, 90, 20]
          }]

      });
    },
  },
  mounted(){
    this.getChart()
  }
-
效果图

折线图
动态图表
步骤仍然和创建基本的图表类似
模拟数据用一个定时器动态刷新即可
// 更新数据
updateData(){
  for (var i = 0; i < 5; i++) {
    this.data.shift();
    this.data.push(this.randomData());
  }
  this.myChart.setOption({
    series: [{
      data: this.data
    }]
  });
}

mounted(){
    // 1. 生成图标随机数据
    this.initData();
    // 2. 创建图表
    this.cheateDynamicChart();
    // 3. 刷新数据
    this.timer = setInterval(this.updateData,1000);
 },
beforeDestroy()
{
    //4. 记着clear 定时器
    clearInterval(this.timer)
}
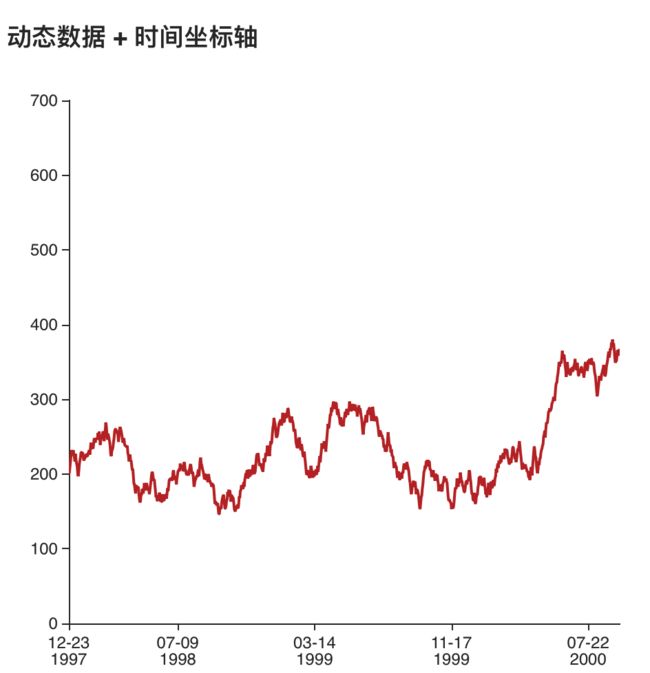
动态图表
动态图标demo
myChart.setOption() 中的参数是什么意思?
在官网上可以看到所有的参数,这些组件用来配置开各种类型的图,功能非常强大。
- title组件 设置图标表头信息
| 名称 | 类型 | 备注 |
|---|---|---|
| id | string | 组件 ID 指定则可用于在 option 或者 API 中引用组件 |
| show | boolean | 是否显示标题组件 |
| link | string | 标题链接 |
| backgroundColor | string, number | 标题背景颜色 |
| subtext | string | 子标题 |
- series[tpye]组件 设置图标样式
| 名称 | 类型 | 备注 |
|---|---|---|
| type | string | 设置图表样式:line:折线图,bar:柱状图,pip:饼图,scatter:散点图,tree:树状图 等 |
| name | sting | 表识数据:如果是折线图,表示该线条名称 |
| 其他参数 | 不同类型,参数不同根据需要设置 |
参考文档
- ECharts官网