线性回归介绍及实验(附代码)
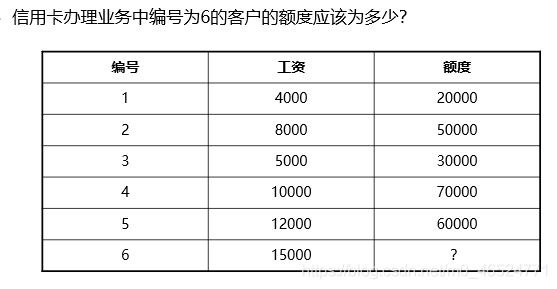
1、线性回归分析(1)
2、线性回归分析(2)
3、误差
注意:高斯分布又称为正态分布
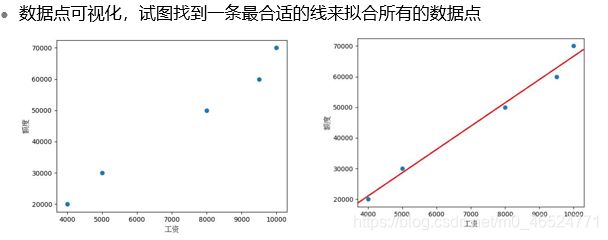
4、一元线性回归
5、多元线性回归目标函数
实验案例:
# -*— coding:utf-8 -*-
# Author:Jun Huang

# 一元线性回归的实现
import matplotlib.pyplot as plt #导入matplotlib库,主要用于可视化
from matplotlib.font_manager import FontProperties
import numpy as np
#引入本地字体文件,否则中文会有乱码
font_set = FontProperties(fname=r"c:\windows\fonts\simsun.ttc", size=12)
# 给出用于训练的数据集
x_train = [4,8,5,10,12]
y_train = [20,50,30,70,60]
# 画出用于训练数据集的散点图,定义一个draw函数,传入训练数据集

def draw(x_train,y_train):
    plt.scatter(x_train, y_train)

def fit(x_train,y_train): #定义函数求得斜率w和截距b
    size = len(x_train)
    numerator = 0 #初始化分子
    denominator = 0#初始化分母0
    for i in range(size):
        numerator += (x_train[i]-np.mean(x_train))*(y_train[i]-np.mean(y_train))
        denominator +=(x_train[i]-np.mean(x_train))**2
    w = numerator/denominator
    b = np.mean(y_train)-w*np.mean(x_train)
    return w,b

def predict(x,w,b):
    #预测模型
    y = w*x+b
    return y

def fit_line(w,b):
    #测试集进行测试,并作图
    x = np.linspace(4,15,9)
    #numpy.limspace(start,stop,num,endpoint=True,retstep=False,dtype=None,axis=0#)
    y = w*x+b
    plt.plot(x,y)
    plt.show()

if __name__ =="__main__":
    draw(x_train,y_train)
    w,b = fit(x_train,y_train)
    print(w,b) #输出斜率和截距
    fit_line(w,b) #绘制预测函数图像
    print(predict(15000,w,b)) #输出当x=15000时的预测结果


