玩转数据可视化之R语言ggplot2:(六)统计变换绘图:包括加权绘图、数据分布图、曲面图、图形重叠处理等
玩转数据可视化之R语言ggplot2
- 个人主页:JoJo的数据分析历险记
- 个人介绍:小编大四统计在读,目前保研到统计学top3高校继续攻读统计研究生
- 如果文章对你有帮助,欢迎关注、点赞、收藏、订阅专栏
本系列主要介绍R语言ggplot2的使用
参考资料:
ggplot2: Elegant Graphics for Data Analysis
文章目录
- 玩转数据可视化之R语言ggplot2
- 6.统计变换绘图
-
- 6.1 展示图形的不确定信息
- 6.2 加权数据绘图
- 6.3 数据分布图
- 6.4 处理图形重叠
-
- 6.4.1 数据量较小
- 6.4.2 数据较大的情况
- 6.4.3 geom_bin2d 和 geom_hex
- 6.5 统计汇总绘图
- 6.6 曲面图
-
- ️6.6.1等高图
- ️ 6.6.2热力图
- ️6.6.3 气泡图
- 文章推荐
6.统计变换绘图
有的时候,我们在对数据进行基本绘图后,还希望对一些统计量进行绘图,例如想要得到置信区间、平均值等。
本章我们讨论一下这种类型图绘制方法
6.1 展示图形的不确定信息
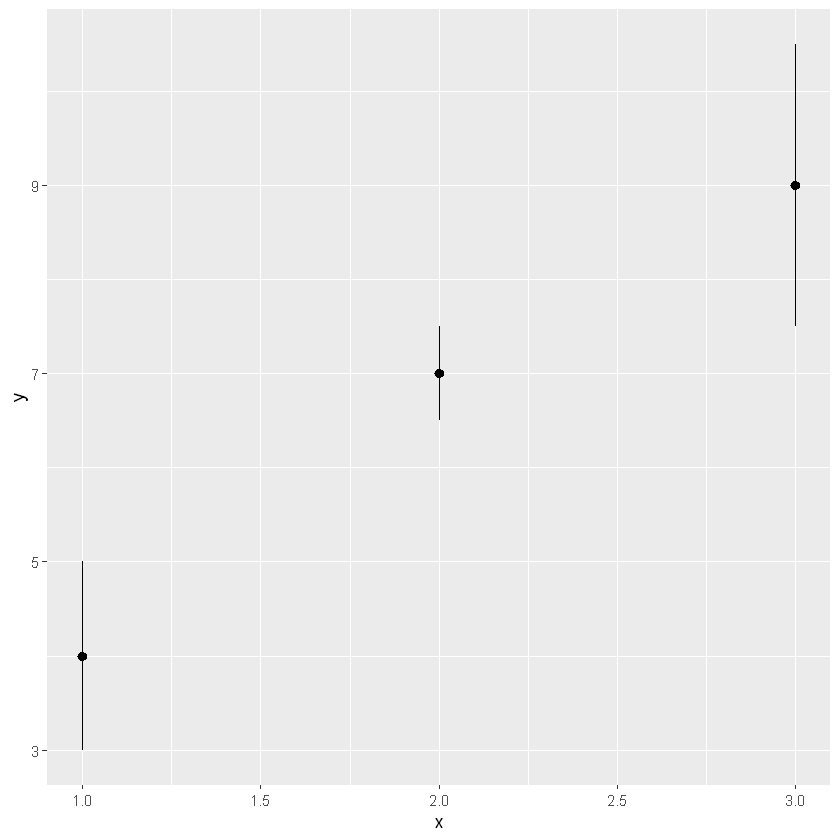
有的时候我们的数据或者模型可能包含一些不确定信息,例如标准差,这个时候我们在绘图时最好将其显示出来。主要有以下几个geoms方法:
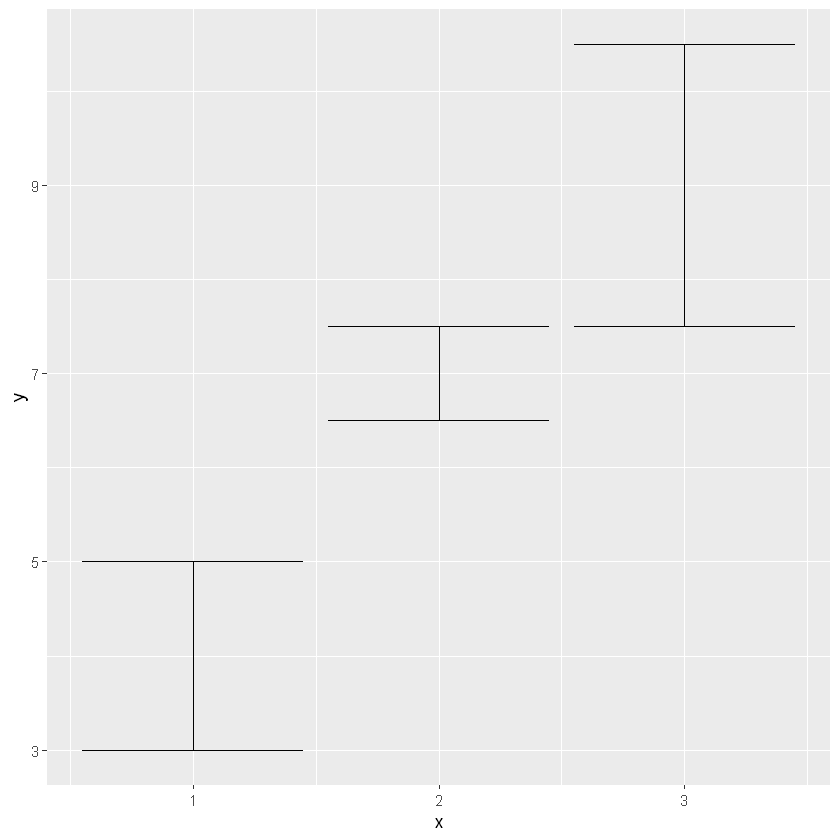
- 离散变量:geom_errorbar(),geom_linerange(),只显示不确定性的范围
- 离散变量:geom_crossbar(),geom_pointrange(),既显示中心值,又显示不确定性的范围
- 连续变量:geom_ribbon(),只显示不确定性的范围
- 连续变量:geom_smooth(),既显示中心值,又显示不确定性的范围
这些几何对象假设我们想要研究在给定x的情况下,y的分布情况,并且我们通过ymin和ymax来定义范围
下面我们以一个实际案例来具体理解一下
library(ggplot2)
# 模拟数据
y <- c(4,7,9)
df <- data.frame(x=1:3,y=y, se = c(1,0.5,1.5))
p <- ggplot(df,aes(x,y,ymin=y-se,ymax=y+se))
为了演示上述所有的几何对象,我们在这里分别按连续变量和离散变量进行分析(实际应该看做一个离散变量更好)
p + geom_crossbar()
p + geom_pointrange()
p + geom_smooth(stat = 'identity')
上面三幅图都是带有中心点的,下面三幅图没有带中心点的。具体怎么选择看我们研究的重点,假设我们只对这个数据的分布范围感兴趣,那么选择下述图形可能更好
p + geom_errorbar()
p + geom_linerange()
p + geom_ribbon()
6.2 加权数据绘图
当我们的研究数据集某一行代表多个数据时,例如人口数量。我们在绘图时可能需要考虑这个权重变量。下面我们以2000年美国人口普查数据集midwest包括中西部各州的数据。我们先来看一下这个数据集(这个数据集是ggplot2包自带的)
head(midwest)
| PID | county | state | area | poptotal | popdensity | popwhite | popblack | popamerindian | popasian | ... | percollege | percprof | poppovertyknown | percpovertyknown | percbelowpoverty | percchildbelowpovert | percadultpoverty | percelderlypoverty | inmetro | category |
|---|---|---|---|---|---|---|---|---|---|---|---|---|---|---|---|---|---|---|---|---|
| ... | ||||||||||||||||||||
| 561 | ADAMS | IL | 0.052 | 66090 | 1270.9615 | 63917 | 1702 | 98 | 249 | ... | 19.63139 | 4.355859 | 63628 | 96.27478 | 13.151443 | 18.01172 | 11.009776 | 12.443812 | 0 | AAR |
| 562 | ALEXANDER | IL | 0.014 | 10626 | 759.0000 | 7054 | 3496 | 19 | 48 | ... | 11.24331 | 2.870315 | 10529 | 99.08714 | 32.244278 | 45.82651 | 27.385647 | 25.228976 | 0 | LHR |
| 563 | BOND | IL | 0.022 | 14991 | 681.4091 | 14477 | 429 | 35 | 16 | ... | 17.03382 | 4.488572 | 14235 | 94.95697 | 12.068844 | 14.03606 | 10.852090 | 12.697410 | 0 | AAR |
| 564 | BOONE | IL | 0.017 | 30806 | 1812.1176 | 29344 | 127 | 46 | 150 | ... | 17.27895 | 4.197800 | 30337 | 98.47757 | 7.209019 | 11.17954 | 5.536013 | 6.217047 | 1 | ALU |
| 565 | BROWN | IL | 0.018 | 5836 | 324.2222 | 5264 | 547 | 14 | 5 | ... | 14.47600 | 3.367680 | 4815 | 82.50514 | 13.520249 | 13.02289 | 11.143211 | 19.200000 | 0 | AAR |
| 566 | BUREAU | IL | 0.050 | 35688 | 713.7600 | 35157 | 50 | 65 | 195 | ... | 18.90462 | 3.275891 | 35107 | 98.37200 | 10.399635 | 14.15882 | 8.179287 | 11.008586 | 0 | AAR |
粗略来看该数据主要包括各州或地区的白种人百分比、贫困线以下百分比、总人口、人口密度、面积等
我们可以从以下几个方面考虑加权变量:
- 使用地区总人口作为加权变量
- 使用地区面积
权重变量的会严重影响我们在图中看到的内容以及我们将得出的结论。
有两种美学属性可用于调整权重。首先,对于线和点等简单几何图形,使用size美学
例如我们想要研究白种人百分比和贫困线以下百分比,分别研究考虑人口和不考虑人口为权重变量的影响
# 不加任何权重
ggplot(midwest,aes(percwhite, percbelowpoverty)) +
    geom_point()

# 以总人口为权重
ggplot(midwest,aes(percwhite,percbelowpoverty))+
    geom_point(aes(size=poptotal/10^6))+
    scale_size
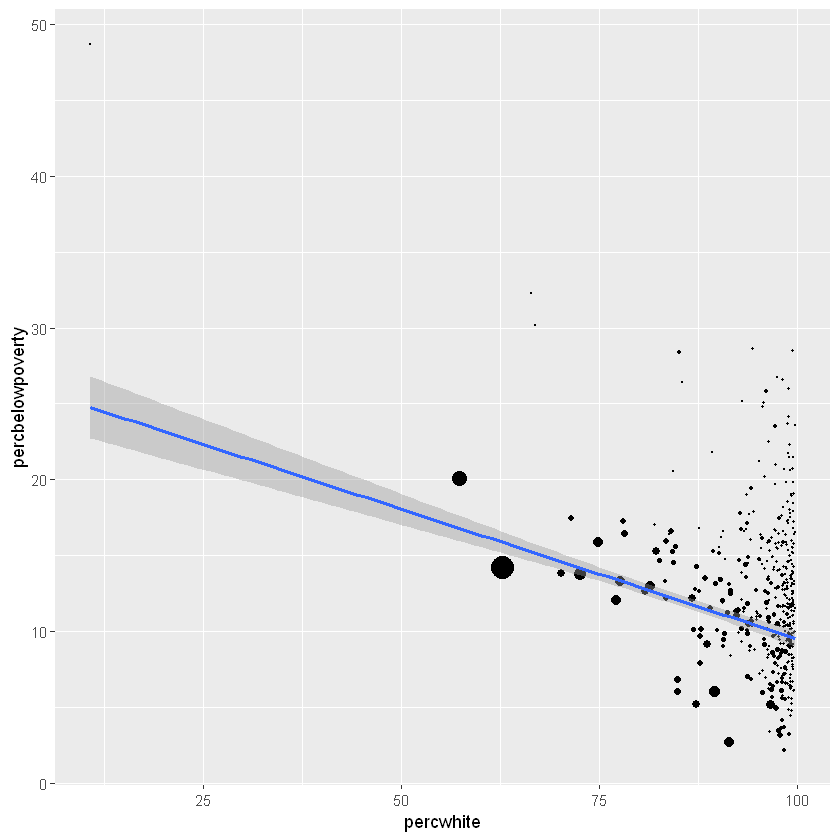
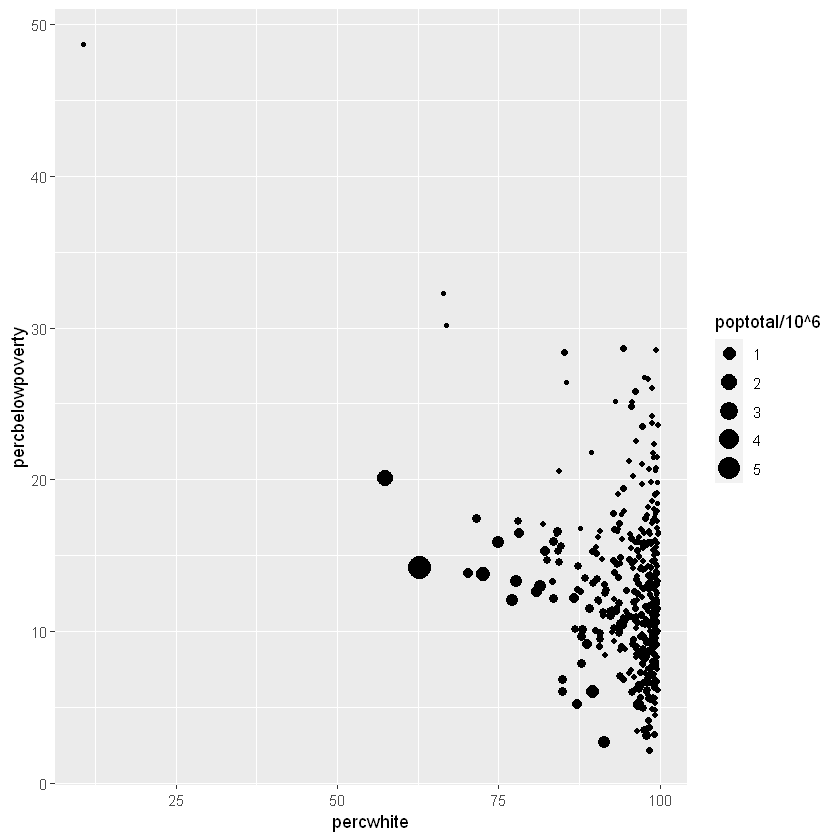 我们认为这些人口较多的地区对整体情况占比应该要更重要一些,因此在进行分析时需要考虑权重因素。
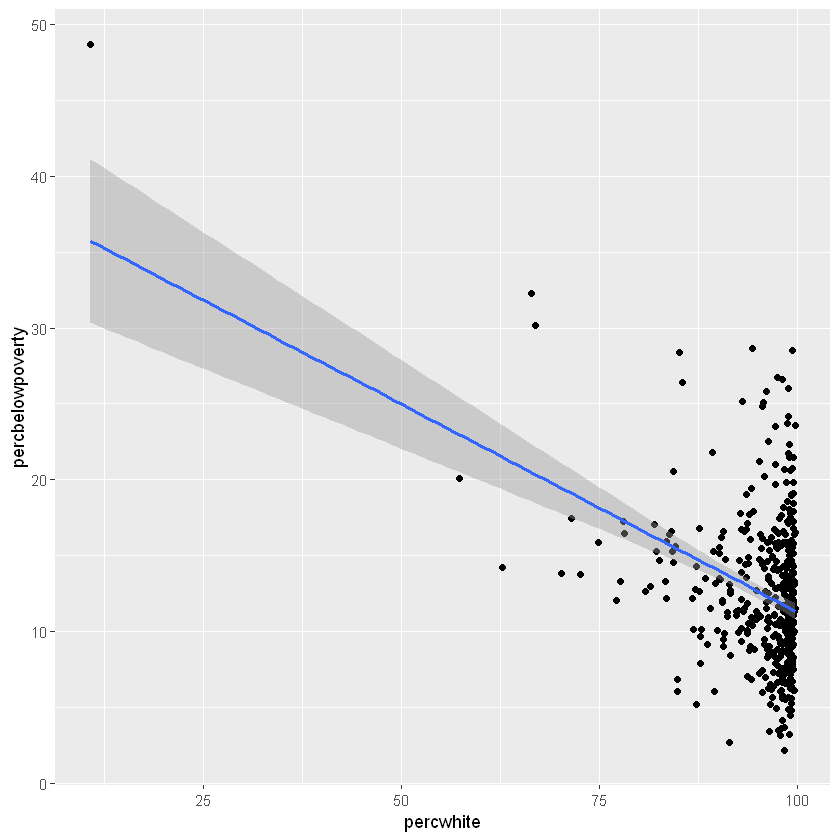
对于涉及一些统计变换的更复杂的图形,我们使用weight美学来指定权重。这些权重将传递给统计汇总函数。虽然我们不能直接看到权重变量,但它会改变统计摘要的结果。下面的代码显示了人口权重如何影响白人百分比和贫困线以下百分比之间的关系。
# 不适用权重变量
ggplot(midwest, aes(percwhite, percbelowpoverty)) +
  geom_point() +
  geom_smooth(method = lm, size = 1)
`geom_smooth()` using formula 'y ~ x'
# 使用权重变量
ggplot(midwest, aes(percwhite, percbelowpoverty)) +
  geom_point(aes(size = poptotal / 1e6)) +
  geom_smooth(aes(weight = poptotal), method = lm, size = 1)+
  scale_size_area(guide='none')
`geom_smooth()` using formula 'y ~ x'
注意:乍一看可能我们没有发现两天曲线的区别,但仔细看,可以发现他们的截距和斜率明显发生了变化,斜率变得更平缓了这说明引入了权重之后削弱了白人比对贫困率以下比的影响
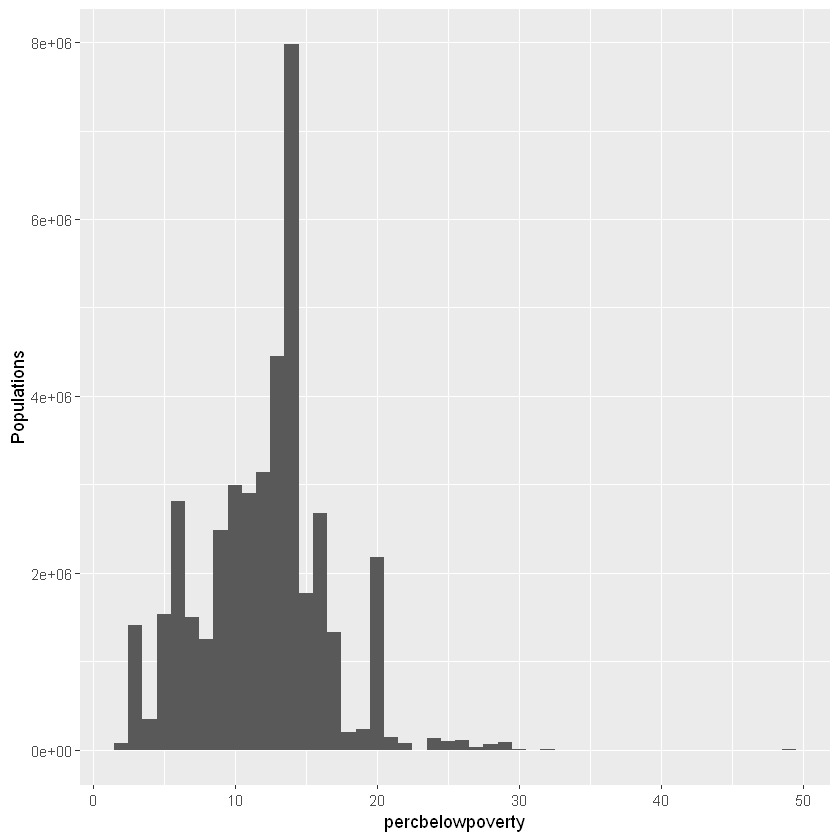
下面我们再来看一下使用权重变量贫困线以下比例的直方图分布情况差异
ggplot(midwest,aes(percbelowpoverty)) +
    geom_histogram(binwidth = 1) +
    ylab('Counties')
ggplot(midwest, aes(percbelowpoverty))+
    geom_histogram(aes(weight=poptotal), binwidth = 1)+
    ylab('Populations')
可以看出引入人口变量之后,贫困率整体发生了变化
6.3 数据分布图
在ggplot2中有许多绘制数据分布的几何方法,主要取决于分布的纬度、变量是离散还是连续的、是否是条件分布或联合分布
一维连续分布最重要的geom是直方图
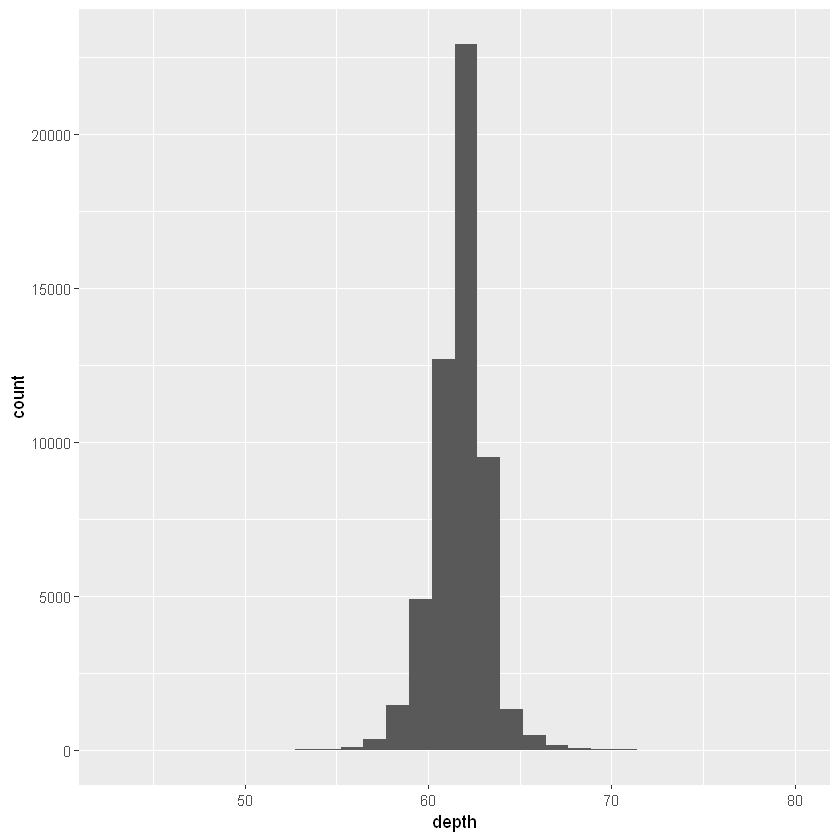
ggplot(diamonds, aes(depth)) +
  geom_histogram()

ggplot(diamonds, aes(depth)) +
  geom_histogram(binwidth = 0.1) +
  xlim(55, 70)
`stat_bin()` using `bins = 30`. Pick better value with `binwidth`.

Warning message:
"Removed 45 rows containing non-finite values (stat_bin)."
Warning message:
"Removed 2 rows containing missing values (geom_bar)."
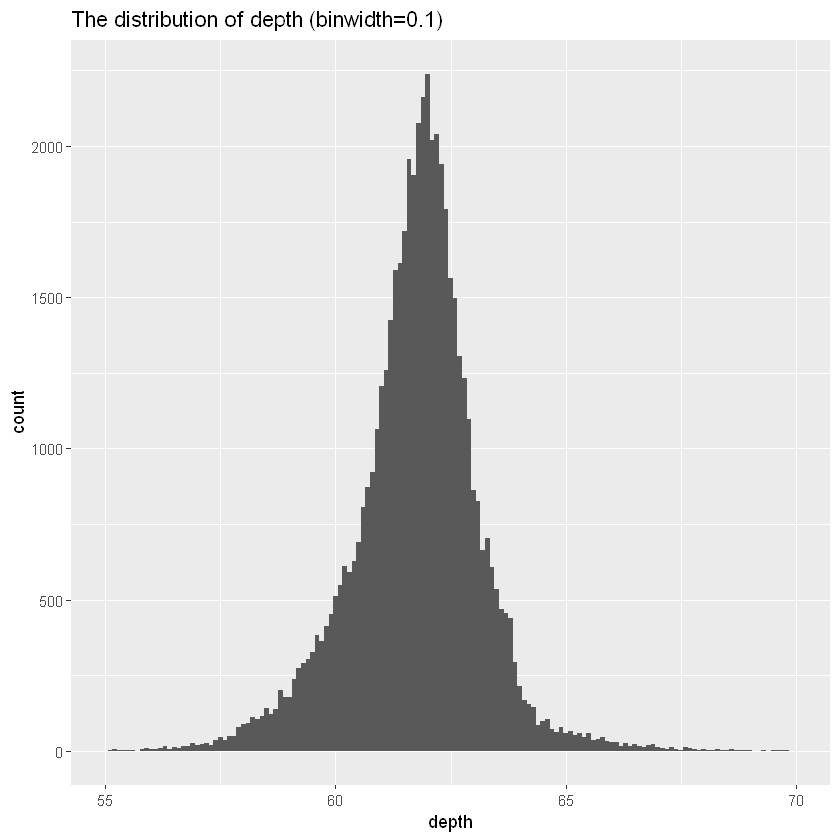
对bin进行测试以找到一个有明确观点是很重要的。我们可以更改binwidth、指定bins或breaks。在x轴上放大坐标轴,设置xlim(55,70),并选择较小的箱子宽度,binwidth=0.1,可以显示更多细节。但是要记住,在我们输出图形时,应该加上这些参数设置。例如:
ggplot(diamonds, aes(depth)) +
  geom_histogram(binwidth = 0.1) +
  xlim(55, 70)+
  ggtitle('The distribution of depth (binwidth=0.1)')
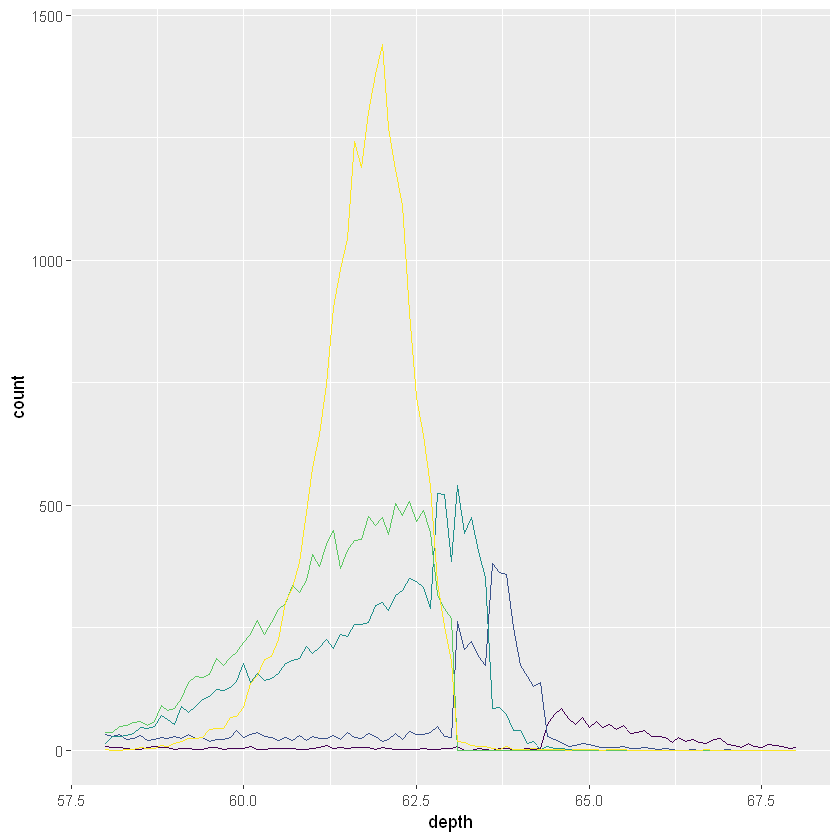
如果我们想要比较不同组的分布,可以使用我们之前介绍的方法
- 分面
- 通过颜色和频率多边形
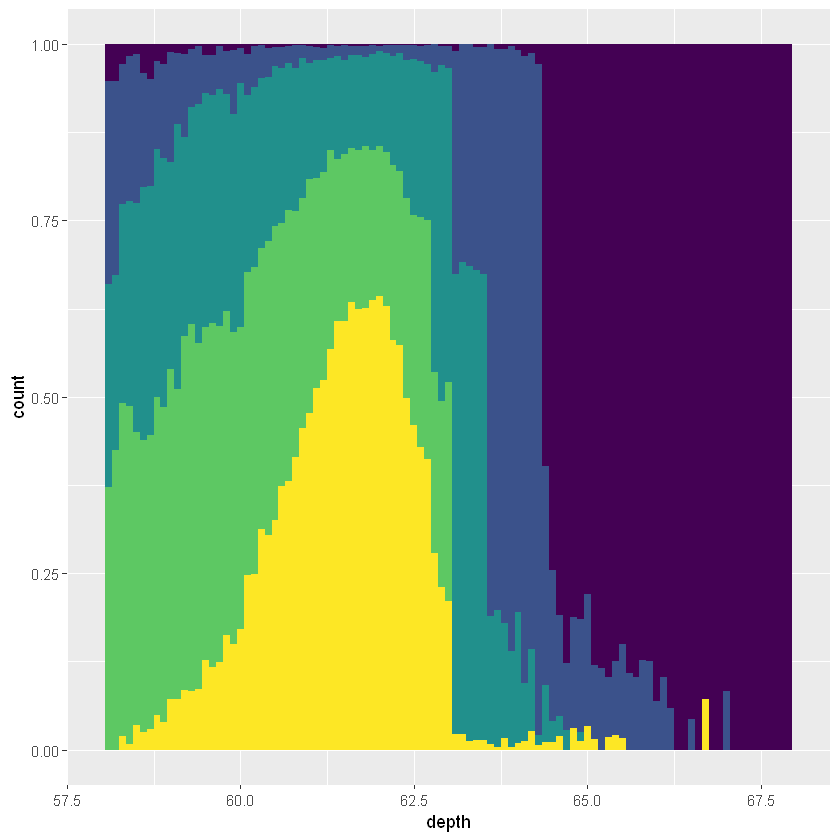
- 使用条件概率密度图,通过geom_histogram(position = ‘fill’)
ggplot(diamonds, aes(depth)) +
  geom_freqpoly(aes(colour = cut), binwidth = 0.1, na.rm = TRUE) +
  xlim(58, 68) +
  theme(legend.position = "none")
ggplot(diamonds, aes(depth)) +
  geom_histogram(aes(fill = cut), binwidth = 0.1, position = "fill",
    na.rm = TRUE) +
  xlim(58, 68) +
  theme(legend.position = "none")
频率多边形和条件密度图如上图所示。条件密度图使用position_fill()堆叠每个bins,将其缩放到相同的高度。这个图形看起来很难,其实是将其进行了缩放,着重展现其分布情况。
直方图和频率多边形geom都使用相同的基本统计变换:stat=“bin”。这个统计产生两个输出变量:数量和密度。默认情况下,count映射到y位置,因为它是最容易解释的。密度是数量除以总数量乘以bin宽度,当我们要比较分布的形态时,使用密度更好。
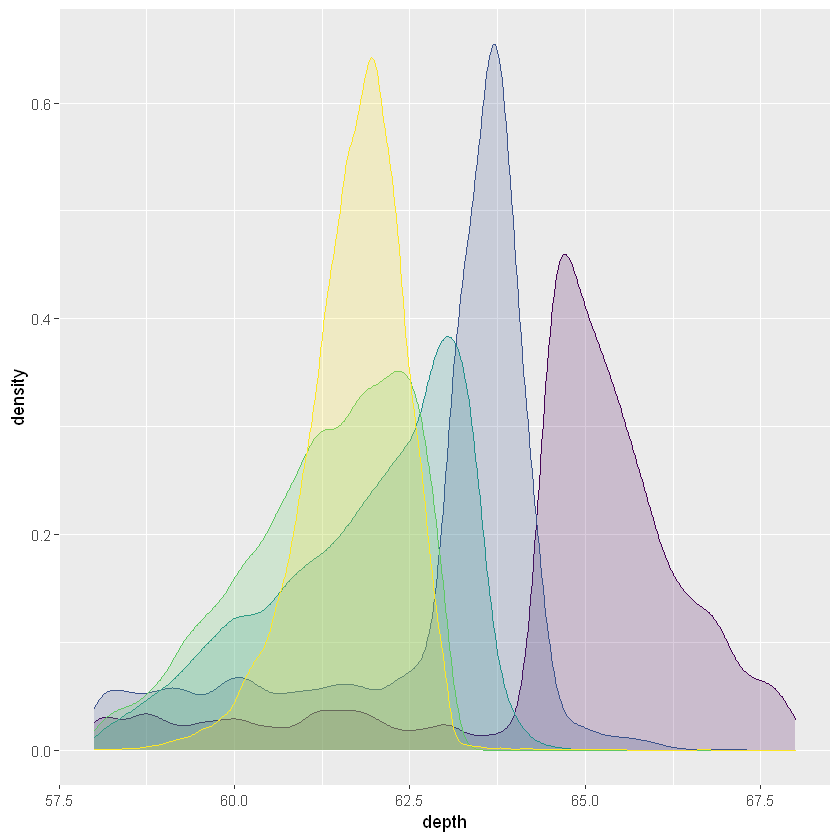
基于bin的可视化另一种方法是geom_density(),它是一种更平滑的图形,当我们知道数据是连续平滑时候,使用geom_density()较好。使用adjust参数调整数据平滑度
# 整体概率密度曲线
ggplot(diamonds, aes(depth)) +
  geom_density(na.rm = TRUE) +
  xlim(58, 68) +
  theme(legend.position = "none")
# 根据cut分组
ggplot(diamonds, aes(depth, fill = cut, colour = cut)) +
  geom_density(alpha = 0.2, na.rm = TRUE) +
  xlim(58, 68) +
  theme(legend.position = "none")
注意,每个密度估计值的面积都被标准化为一,因此我们失去了各个组之间的相对大小信息。
直方图、频率多边形、概率密度曲线展示了数据分布。有时候我们希望比较许多分布,这个时候我们可以选择牺牲一些数据的完整性来换取多个分布。
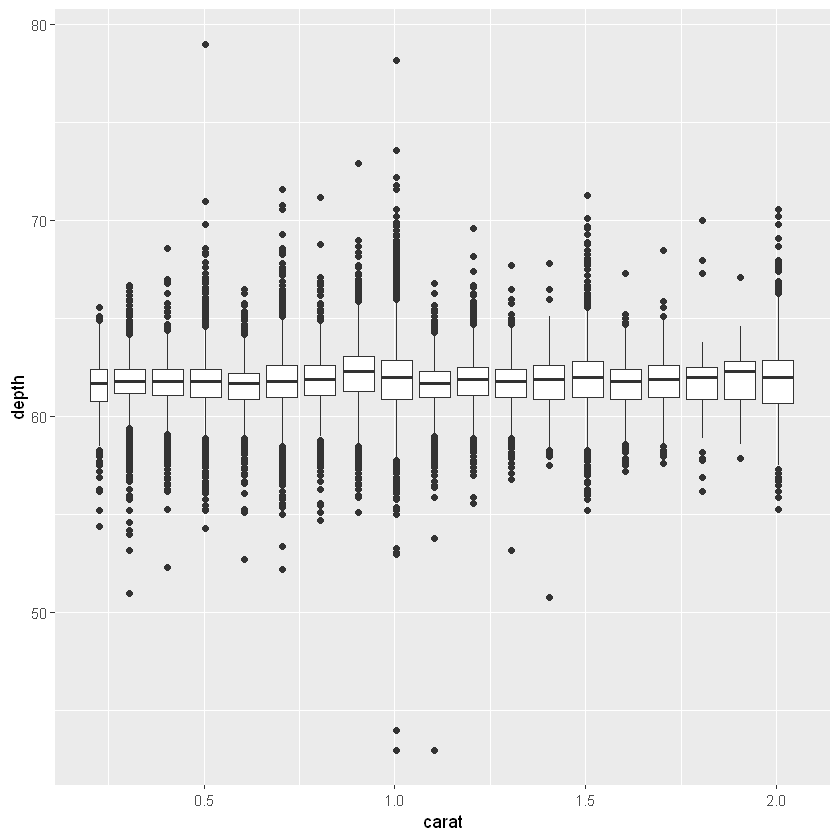
- geom_boxplot():箱线图显示了五个汇总统计数据以及单个“异常值”。它显示的信息比直方图少得多,但占用的空间也少得多。
- 可以将箱线图与分类x和连续x一起使用。对于连续x,需要设置组美学cut_width,以定义如何将x变量分解为箱。
ggplot(diamonds, aes(clarity, depth)) +
  geom_boxplot()
ggplot(diamonds, aes(carat, depth)) +
  geom_boxplot(aes(group = cut_width(carat, 0.1))) +
  xlim(NA, 2.05)
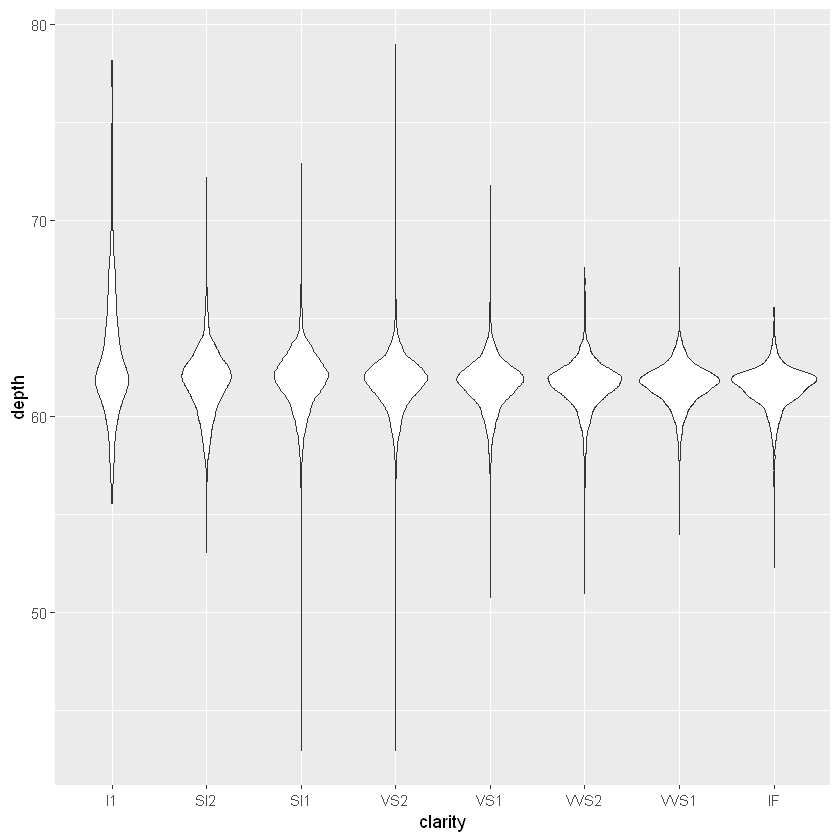
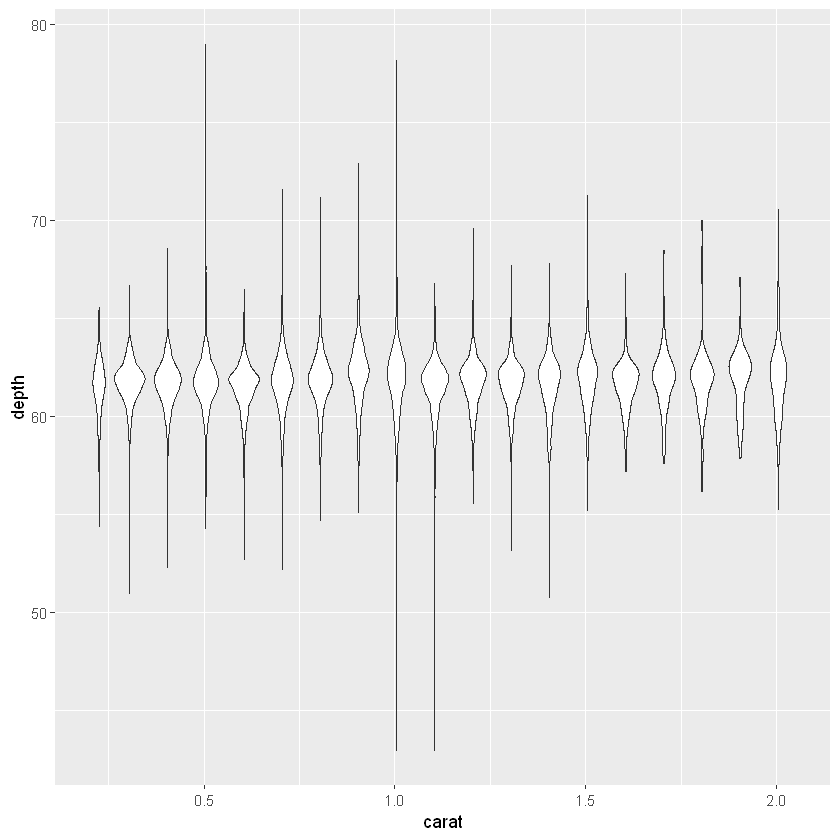
- geom_violin():小提琴图是密度图一直特殊表达,基本计算方式是相同的,但结果以类似于箱线图的方式显示:
ggplot(diamonds, aes(clarity, depth)) +
  geom_violin()
ggplot(diamonds, aes(carat, depth)) +
  geom_violin(aes(group = cut_width(carat, 0.1))) +
  xlim(NA, 2.05)
6.4 处理图形重叠
散点图是我们研究两个变量之间关系非常重要的图形,但是当数据量很大时,容易出现两个点完全重叠,从而掩盖了真实的关系
根据数据的大小,有很多方法可以解决这个问题。
6.4.1 数据量较小
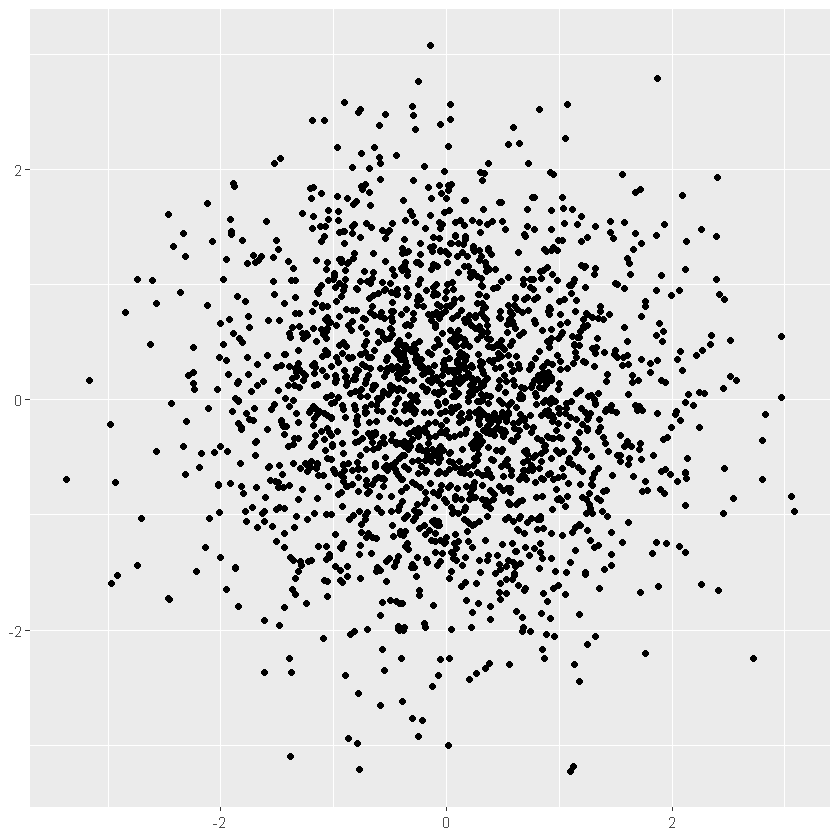
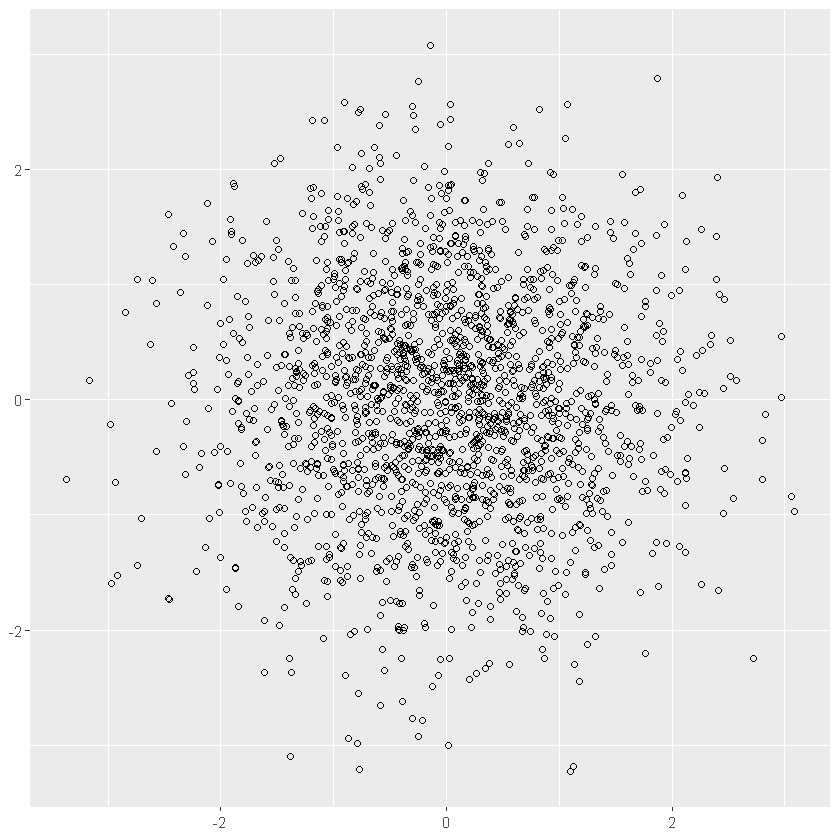
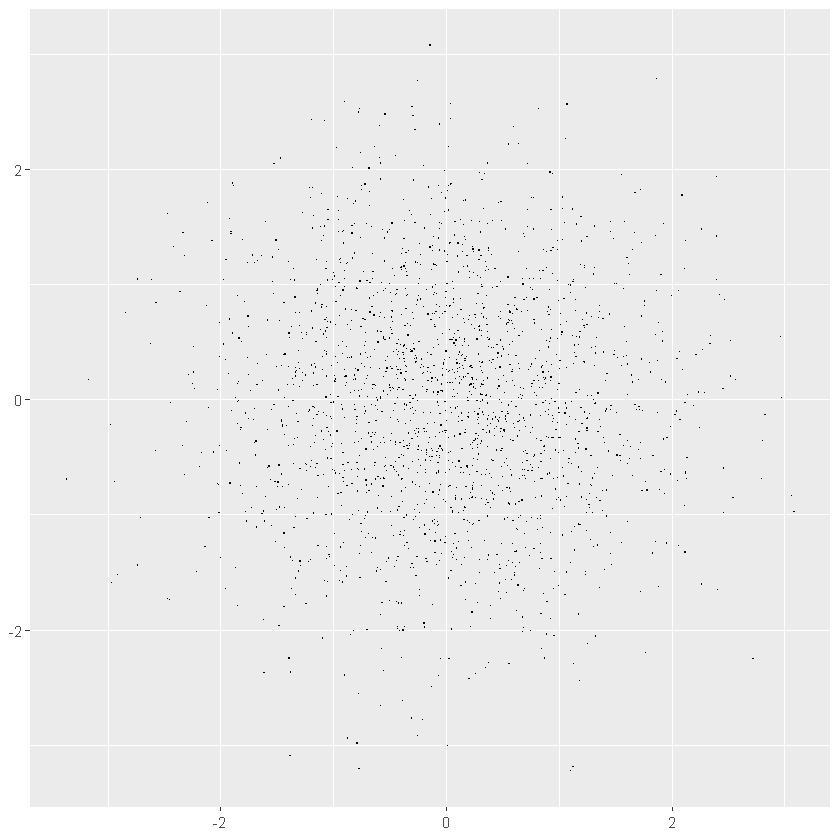
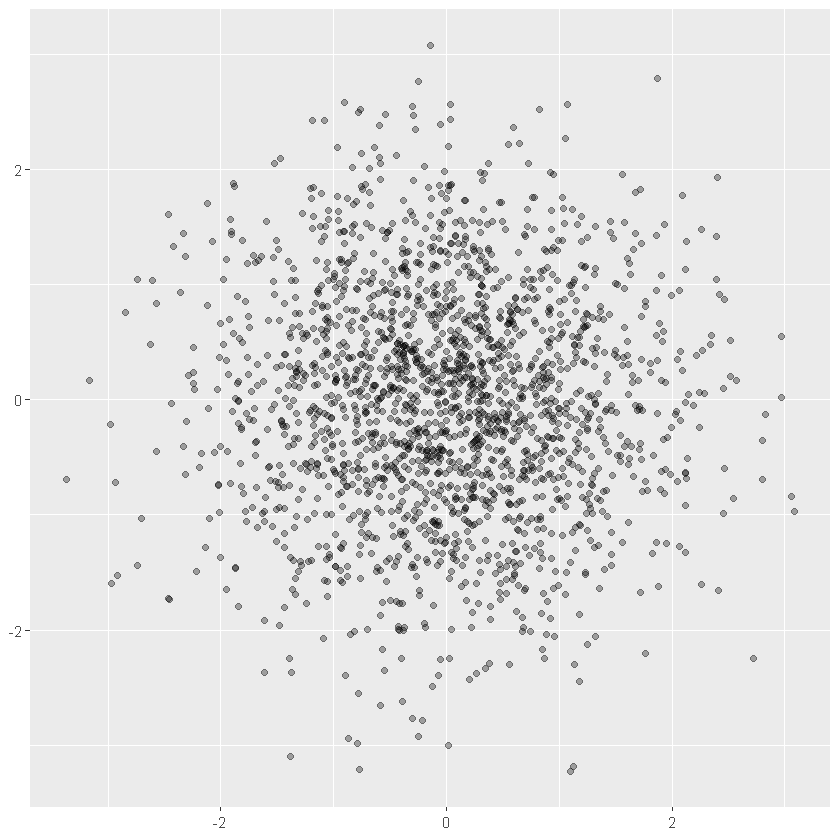
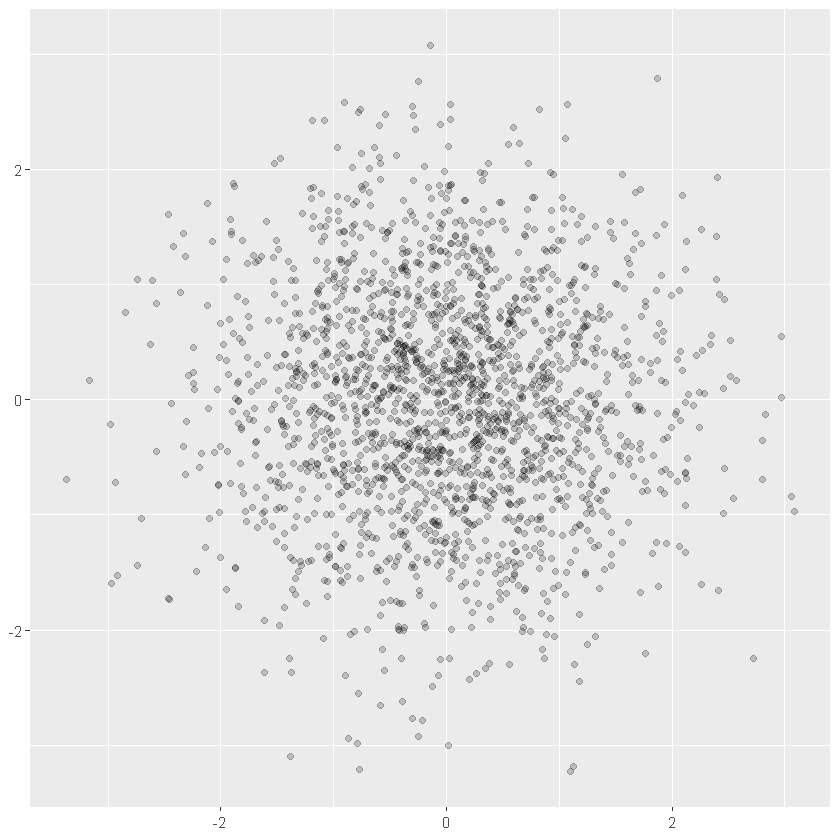
针对数据量较小的情况,我们往往可以选择将设置更小的点来避免图形重叠,下面我们生成2000个来自正态分布的点来说明
df <- data.frame(x = rnorm(2000), y = rnorm(2000))
norm <- ggplot(df, aes(x, y)) + xlab(NULL) + ylab(NULL)
norm + geom_point()
norm + geom_point(shape = 1) # 空心圆
norm + geom_point(shape = ".")
6.4.2 数据较大的情况
对于数据量较大,重叠较严重的情况,我们使用alpha设置图形透明度
norm + geom_point(alpha = 1 / 3)
norm + geom_point(alpha = 1 / 5)
norm + geom_point(alpha = 1 / 10)
6.4.3 geom_bin2d 和 geom_hex
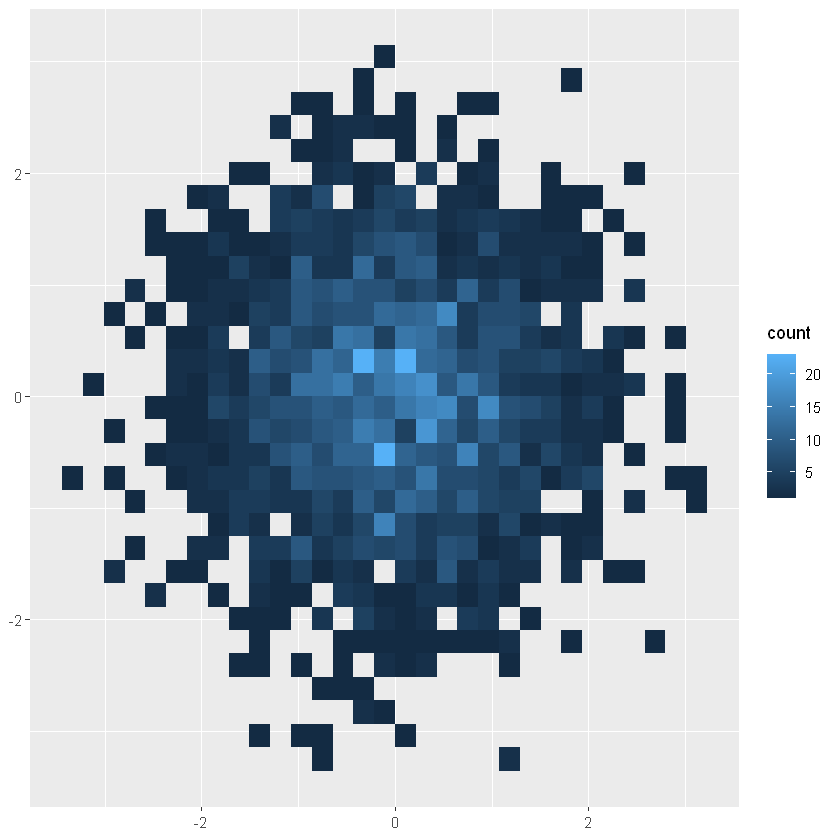
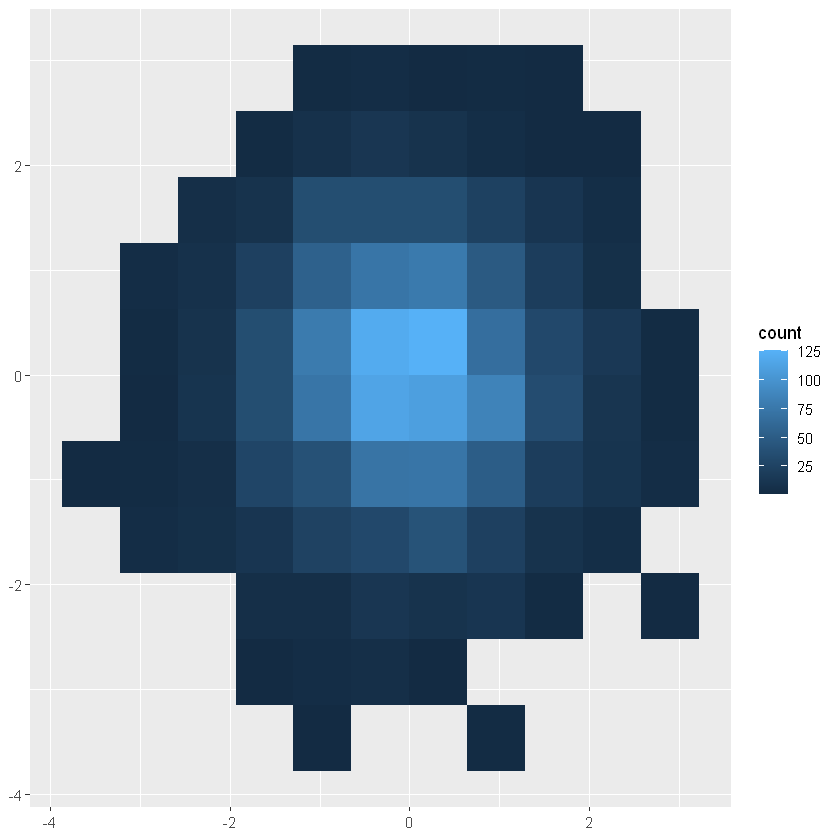
对点进行分类,并计算每个分类中的数字,然后将其可视化(直方图的2维显示)
norm + geom_bin2d()
norm + geom_bin2d(bins = 10)
norm + geom_hex()
norm + geom_hex(bins = 10)
6.5 统计汇总绘图
我们之前使用geom_histogram()和geom_bin2d()统计了某一变量的数量,下面我们介绍和直方图类似的图形,条形图。geom_bar()
和geom_roaster(),默认我们是绘制出数量,但如果我们希望绘制的不是数量,而是其他指标的数据呢?
可以通过stat_summary_bin和stat_summary_bin2d来设置其他指标的数据,下面举例说明。
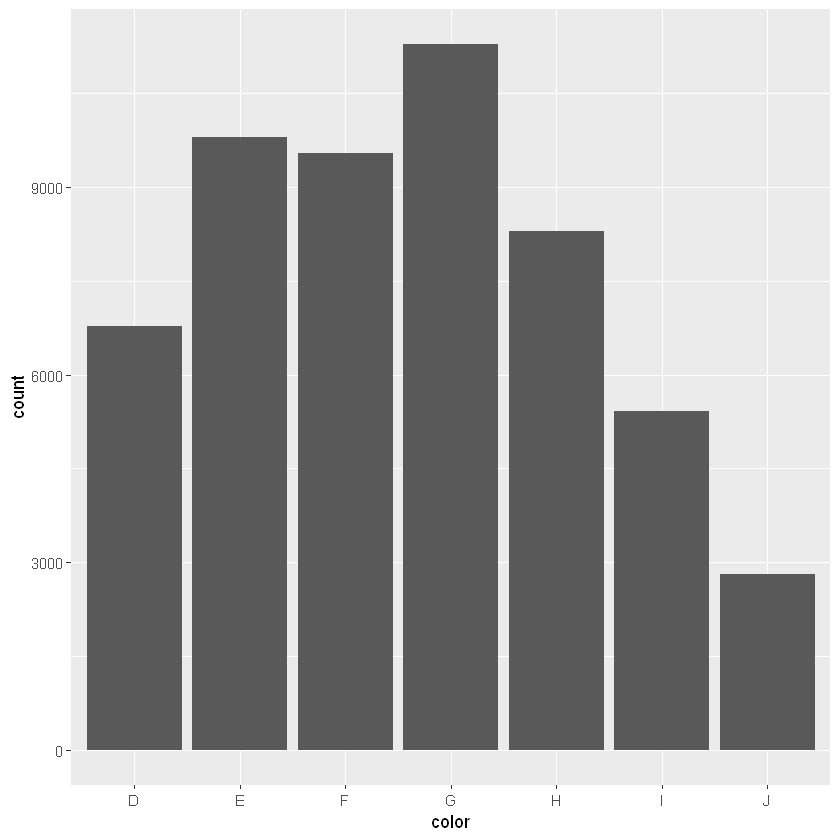
第一个图展现的是不同颜色的数量
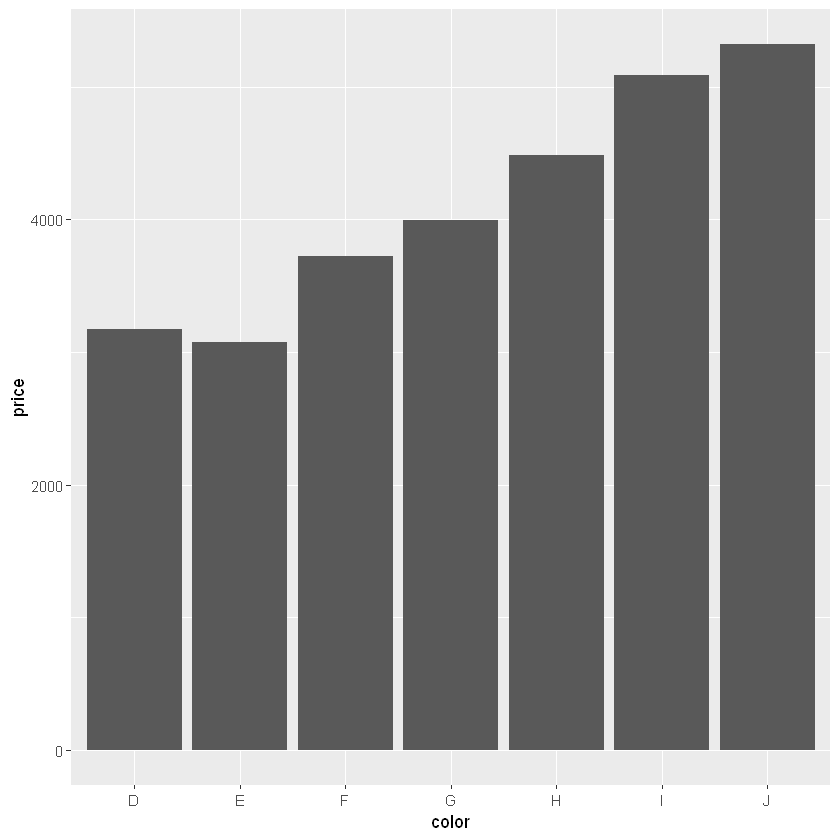
第二个图展现的是不同颜色的平均价格
ggplot(diamonds, aes(color)) +
  geom_bar()

ggplot(diamonds, aes(color, price)) +
  geom_bar(stat = "summary_bin", fun = mean)
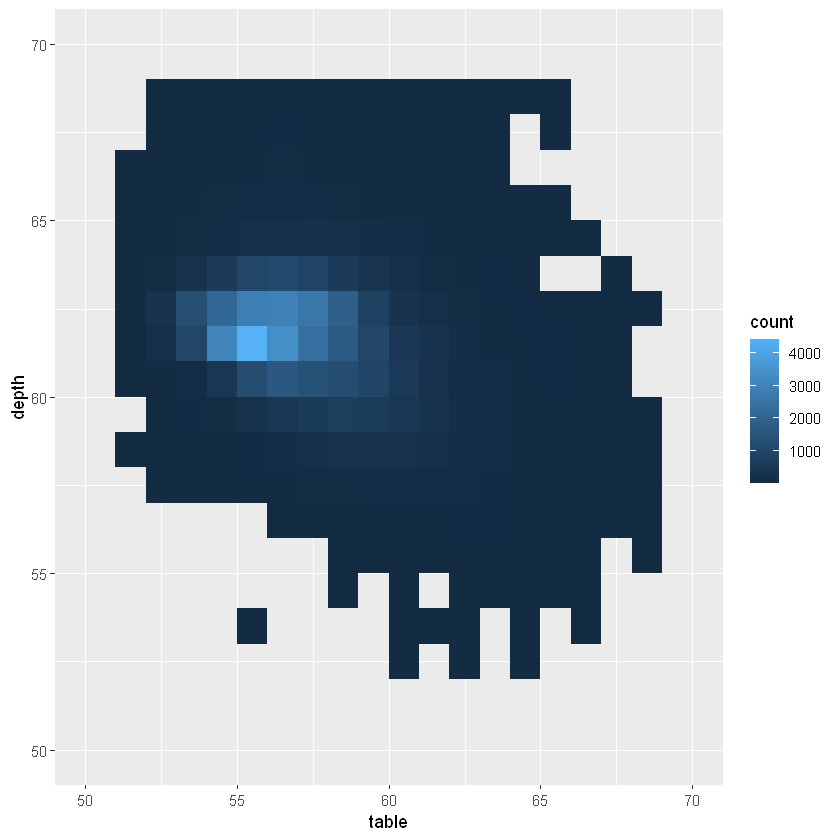
下面再举一个二维的例子,此时我们默认展现的是table和depth在不同数值下的数量,
假设我们想要展示的是价格的平均值,则通过下列代码可以实现
ggplot(diamonds, aes(table, depth)) +
  geom_bin2d(binwidth = 1, na.rm = TRUE) +
  xlim(50, 70) +
  ylim(50, 70)

ggplot(diamonds, aes(table, depth, z = price)) +
  geom_raster(binwidth = 1, stat = "summary_2d", fun = mean,
    na.rm = TRUE) +
  xlim(50, 70) +
  ylim(50, 70)
Warning message:
"Raster pixels are placed at uneven horizontal intervals and will be shifted. Consider using geom_tile() instead."
Warning message:
"Raster pixels are placed at uneven vertical intervals and will be shifted. Consider using geom_tile() instead."
我们还可以设置其他统计量绘制,例题fun=max显示最大值
6.6 曲面图
现在我们考虑需要三维表面的可视化的情况。
ggplot2软件包不支持真正的3d曲面,
但它支持在2d中总结3d曲面的许多常用工具:
等高线和气泡图等。
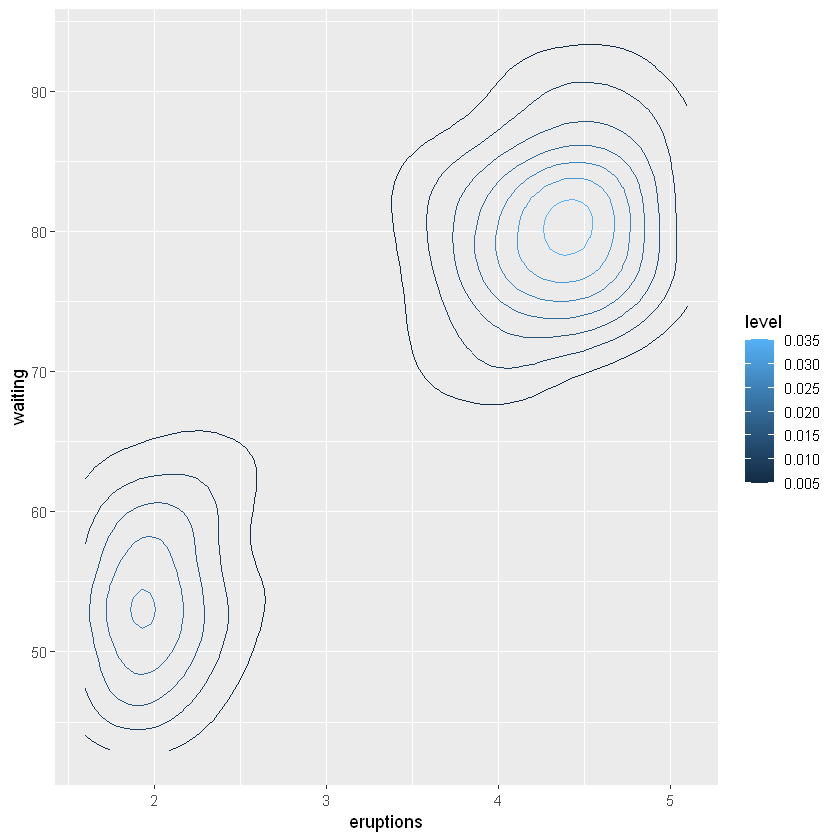
️6.6.1等高图
ggplot(faithfuld, aes(eruptions, waiting)) +
  geom_contour(aes(z = density, colour = ..level..))
️ 6.6.2热力图
ggplot(faithfuld, aes(eruptions, waiting)) +
  geom_raster(aes(fill = density))
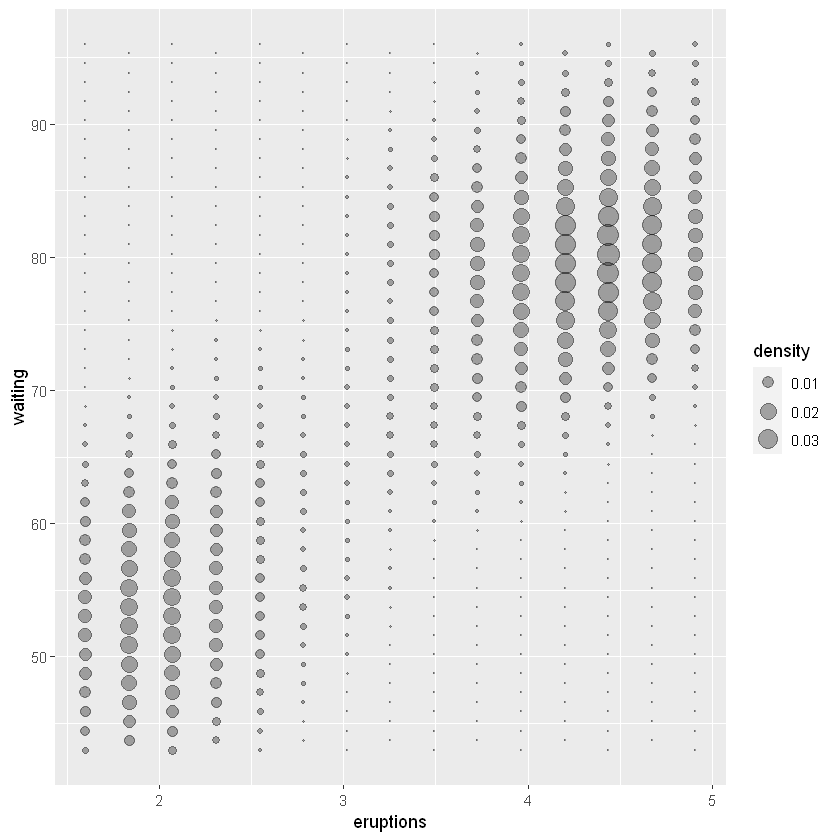
️6.6.3 气泡图
small <- faithfuld[seq(1, nrow(faithfuld), by = 10), ]
ggplot(small, aes(eruptions, waiting)) +
  geom_point(aes(size = density), alpha = 1/3) +
  scale_size_area()
文章推荐
如果想了解更多ggplot2数据可视化技巧,欢迎访问下列文章
☀️玩转数据可视化之R语言ggplot2:(一)ggplot2实现箱线图、小提琴图、直方图等图形(快速入门)
玩转数据可视化之R语言ggplot2:(二)ggplot2实现分面绘图(Faceting),包括连续变量的转换(快速入门)
玩转数据可视化之R语言ggplot2:(三)ggplot2实现将多张图放在一起,包括并排和插图绘制(快速入门)
玩转数据可视化之R语言ggplot2:(四)单一基础几何图形绘制

