椭圆曲线介绍(一):实数上面的椭圆曲线
大部分内容翻译自 ANDREA CORBELLINI的椭圆曲线密码学的介绍:Elliptic Curve Cryptography: a gentle introduction
但我在里面加了一些使用python绘制椭圆曲线的方法,可以复制代码下来自行尝试。
文章目录
- 前言
- 实数和群内的椭圆曲线
-
- 椭圆曲线
- 椭圆曲线群
- 几何学上的意义
- 代数上的加法
- 在这里插入图片描述
- 标量乘法
- 在这里插入图片描述
- 对数问题
- 图片代码
-
- 椭圆曲线:
- 椭圆曲线群:
- 几何学上的意义:
- 标量乘法
- 总结:
前言
了解公钥密码学的人可能听说过ECC,ECDH,ECDSA。ECC就是Elliptic Curve Cryptography的缩写,后面是两个DH和DSA在椭圆曲线上面的算法变种。
椭圆曲线被广泛应用于TLS,PGP,SSH中,以及区块链和零知识证明算法中。
在椭圆曲线火起来之前,大多是的公钥密码方案都是基于RSA,DSA,DH的,而且都是在 Z q Z_q Zq上的。而整数模的密码方案都很好理解,也比较好实现,而ECC就听起来神秘很多。所以这里就简单介绍一下ECC是什么,为什么要用它构造密码方案,为什么这样的方案是安全的。
实数和群内的椭圆曲线
椭圆曲线
首先,椭圆曲线是什么,一个简单的定义是,是由 y 2 = x 3 + a x + b , ( 4 a 3 + 27 b 2 ≠ 0 ) y^2 = x^3+ax+b,(4a^3+27b^2\ne 0) y2=x3+ax+b,(4a3+27b2=0)上面的所有点构成的一个集合。形状上类似:

为什么会有 ( 4 a 3 + 27 b 2 ≠ 0 ) (4a^3+27b^2\ne 0) (4a3+27b2=0)的约束是因为这样的曲线是奇异的,类似于:
这样的椭圆曲线是与自己相交的,不采用这样的椭圆曲线。
可以看出,椭圆曲线是关于 x x x轴对称的。除了上面曲线的所有点之外,我们还要定义一个无穷远点。将无穷远点也当做曲线的一部分,记作 0 0 0。那么椭圆曲线上面的所有点就是
{ ( x , y ) ∈ R 2 ∣ y 2 = x 3 + a x + b , 4 a 3 + 27 b 2 ≠ 0 } ∪ { 0 } \left\{(x, y) \in \mathbb{R}^{2} \mid y^{2}=x^{3}+a x+b, 4 a^{3}+27 b^{2} \neq 0\right\} \cup\{0\} {(x,y)∈R2∣y2=x3+ax+b,4a3+27b2=0}∪{0}
椭圆曲线群
关于群有不了解的可以看这里:群环域,理想商环,原根复习。
椭圆曲线是具有加法交换群的性质的:
- 群中的元素是椭圆曲线上面的点
- 椭圆曲线的单位元是 0 0 0(定义的无穷远点)
- 一个点 P P P的逆元 − P -P −P就是 P P P关于 x x x轴对称的那个点
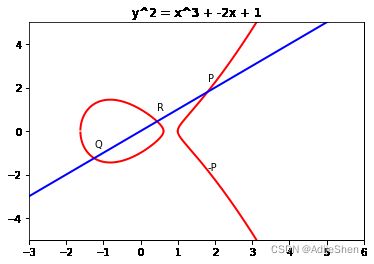
- 加法的定义如下:令 P , Q , R P,Q,R P,Q,R是一条直线与椭圆曲线的三个交点,则 P + Q + R = 0 ⟷ Q + R = − P P+Q+R=0 \longleftrightarrow Q+R=-P P+Q+R=0⟷Q+R=−P。

图3:椭圆曲线加法
注意到,根据加法的定义,很容易得知 P + ( Q + R ) = Q + ( P + R ) = R + ( P + Q ) = ⋯ = 0 P+(Q+R)=Q+(P+R)=R+(P+Q)=\cdots=0 P+(Q+R)=Q+(P+R)=R+(P+Q)=⋯=0,因此,可以知道椭圆曲线是一个加法的交换群。
几何学上的意义
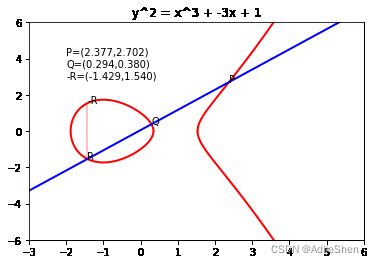
P + Q P+Q P+Q加法的几何学上面的意义就是找到直线 P Q PQ PQ与椭圆曲线的交点 R R R,根据 P + Q + R = 0 P+Q+R=0 P+Q+R=0的性质,就可以得到 P + Q = − R P+Q=-R P+Q=−R,即 R R R关于 x x x轴的对称点 − R -R −R就是 P + Q P+Q P+Q的结果。
但这只是一般情况的,如果遇到的是特殊情况呢?比如:
- 如果 P = 0 P=0 P=0或 Q = 0 Q=0 Q=0呢?这样子是无法通过在二位平面上表达出来的,因为我们定义的 0 0 0是个无穷远点。但 0 0 0是椭圆曲线群的单位元,所以 P + 0 = P , Q + 0 = Q P+0=P,Q+0=Q P+0=P,Q+0=Q。
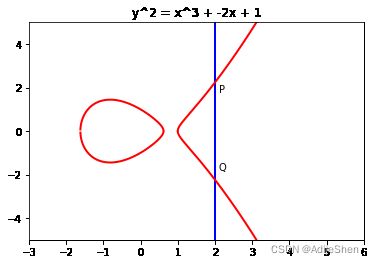
- 如果 P = − Q P=-Q P=−Q呢?那如果画出直线来, P Q PQ PQ就是关于 x x x轴垂直的一条线,很容易看出来这样的直线与椭圆曲线只有两个交点,但根据定义,我们可以得到 P + ( − P ) = 0 P+(-P)=0 P+(−P)=0。
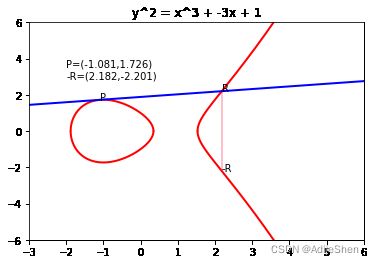
- 如果 P = Q P=Q P=Q呢?那就是过点 P P P的椭圆曲线的切线与椭圆曲线的另一个交点的逆了。
可以到网站上试一下:https://andrea.corbellini.name/ecc/interactive/reals-add.html
代数上的加法
知道了椭圆曲线的计算规则,那要如何计算呢?令 P = ( x P , y p ) , Q = ( x Q , y Q ) P=(x_P,y_p),Q=(x_Q,y_Q) P=(xP,yp),Q=(xQ,yQ)。
如果 P , Q P,Q P,Q是两个不同点,那么经过他们的直线的斜率为:
m = y P − y Q x P − x Q m=\frac{y_P-y_Q}{x_P-x_Q} m=xP−xQyP−yQ
他们与椭圆曲线的交点的坐标为 R = ( x R , y R ) R=(x_R,y_R) R=(xR,yR),其中
x R = m 2 − x P − x Q y R = y P + m ( x R − x P ) o r y R = y Q + m ( x R − x Q ) \begin{aligned} &x_R = m^2-x_P-x_Q\\ &y_R = y_P+m(x_R-x_P)\\ &or\\ &y_R = y_Q + m(x_R-x_Q)\\ \end{aligned} xR=m2−xP−xQyR=yP+m(xR−xP)oryR=yQ+m(xR−xQ)

如果 P = Q P=Q P=Q,则计算方法为:
m = 3 x P 2 + a 2 y P m=\frac{3x_P^2 + a}{2y_P} m=2yP3xP2+a
这个式子其实就是 y P = x P 3 + a x P + b y_P=\sqrt{x^3_P +ax_P+b} yP=xP3+axP+b的求导。
然后 x R , y R x_R,y_R xR,yR的算法是一致的:
x R = m 2 − 2 x P y R = y P + m ( x R − x P ) \begin{aligned} &x_R = m^2-2x_P\\ &y_R = y_P+m(x_R-x_P)\\ \end{aligned} xR=m2−2xPyR=yP+m(xR−xP)
标量乘法
椭圆曲线上没有定义点和点之间的乘法,只有标量乘法,而标量乘法是通过加法来实现的:
n P = P + P + ⋯ + P ⏟ n times n P=\underbrace{P+P+\cdots+P}_{n \text { times }} nP=n times P+P+⋯+P
假设add和double的复杂度是 O ( 1 ) O(1) O(1)的,那么单纯这样的一个标量乘法的复杂度是 O ( n ) O(n) O(n)的,然而却可以通过一些方法来变成 O ( log n ) O(\log n) O(logn)的。比如 n = 151 n=151 n=151的时候,可以把它拆解为 1001011 1 2 10010111_2 100101112,即 151 P = 128 P + 16 P + 4 P + 2 P + P 151P=128P + 16P+4P+2P+P 151P=128P+16P+4P+2P+P,这样子只需要调用 7 7 7次double方法和5次add方法。而直接算的话要调用150次add方法。
对数问题
我们知道在 Z q Z_q Zq上的离散对数问题是这样的,令 g ∈ Z q , h = g x m o d q g\in Z_q,h=g^x\bmod q g∈Zq,h=gxmodq,那么通过 ( g , h ) (g,h) (g,h)求出 x x x是困难的。
而在椭圆曲线上,我们这样定义对数问题:令 P P P属于某个椭圆曲线, Q = n P Q=nP Q=nP,那个给定 ( P , Q ) (P,Q) (P,Q),求出 n n n是困难的。严格意义上来说这种问题应该叫做椭圆曲线上面的除法难题,为了保持一致,我们也叫做椭圆曲线上的对数难题。
值得注意的是连续的椭圆曲线上面的对数问题并非是完全不可解,因为他有某种规律:可以在这个网站(椭圆曲线加乘可视化)上尝试一下:比如曲线 y 2 = x 3 − 3 x + 1 y^2=x^3-3x+1 y2=x3−3x+1, P = ( 0 , 1 ) P=(0,1) P=(0,1)。令 Q = n P Q=nP Q=nP,很容易看出来,当 n n n为奇数的时候, Q Q Q在左侧曲线, n n n为偶数的时候, Q Q Q在右侧曲线。因此这种对数并非无迹可寻。
在下一节中会介绍整数域上面的椭圆曲线,定义在整数域上面的椭圆曲线中的对数问题被称作离散对数问题,是密码学中的一个标准难题假设。
图片代码
椭圆曲线:
import matplotlib.pyplot as plt
import numpy as np
fig, axs = plt.subplots(2, 3, figsize=(9, 6), sharey=True)
a = -3
b = 1
for i in range(2):
    for j in range(3):
        # make data
        x = np.linspace(-5, 10, 10000)
        y = np.sqrt(x**3 + a*x + b)
        y2 = -np.sqrt(x**3 + a*x + b)
        # plot
        axs[i][j].plot(x, y, linewidth=2.0, color='red')
        axs[i][j].plot(x, y2, linewidth=2.0, color='red')
        axs[i][j].set_title('y^2 = x^3 + {}x + {}'.format(a,b))
        axs[i][j].set(xlim=(-5, 8), xticks=np.arange(-5, 8),
               ylim=(-8, 8), yticks=np.arange(-8, 8))
        a = a+1
plt.show()
椭圆曲线群:
import matplotlib.pyplot as plt
import numpy as np

a=-2
b=1

# make data
x = np.linspace(-5, 10, 10000)
y = np.sqrt(x**3 + a*x + b)
y2 = -np.sqrt(x**3 + a*x + b)

y3 = x

# plot
fig, ax = plt.subplots()

# plot
ax.plot(x, y, linewidth=2.0, color='red')
ax.plot(x, y2, linewidth=2.0, color='red')
ax.plot(x, y3, linewidth=2.0, color='blue')
ax.set_title('y^2 = x^3 + {}x + {}'.format(a,b))
ax.set(xlim=(-3, 6),
       ylim=(-5, 5))
poly = np.array([1,-1,-2,1])
r = np.roots(poly)
labels = ['P','Q','R']
for i in range(len(r)):
    ax.annotate(labels[i], xy=(r[i], r[i]), xytext=(r[i], r[i]+0.5))
ax.annotate('-P', xy=(r[0], -r[0]), xytext=(r[0], -r[0]))
plt.show()
几何学上的意义:
import matplotlib.pyplot as plt
import numpy as np
import warnings
warnings.filterwarnings("ignore")

def random_point(curve):
    a = curve[0]
    b = curve[1]
    y=-1
    x=-1
    s = -1
    while(y<0):
        x = np.random.rand()*6-3
        y = x**3 + a*x+b
        s = s*-1
    return (x,s*np.sqrt(y))

def add(P,Q):
    xp = P[0]
    yp = P[1]
    xq = Q[0]
    yq = Q[1]
    m = (yp-yq)/(xp-xq)
    xr = m**2 - xp-xq
    yr = yp+m*(xr-xp)
    return (xr,-yr,m)

def double(P,curve):
    a = curve[0]
    b = curve[1]
    xp = P[0]
    yp = P[1]
    m = (3*xp**2 +a)/(2*yp)
    xr = m**2 - 2*xp
    yr = yp+m*(xr-xp)
    return (xr,-yr,m)

def plot_random_add(curve):
    a = curve[0]
    b = curve[1]

    # make data
    x = np.linspace(-5, 20, 100000)
    y = np.sqrt(x**3 + a*x + b)
    y2 = -np.sqrt(x**3 + a*x + b)

    # plot
    fig, ax = plt.subplots()

    # plot curve
    ax.plot(x, y, linewidth=2.0, color='red')
    ax.plot(x, y2, linewidth=2.0, color='red')
    R=(300,300)
    while(R[0]>20):
        P = random_point(curve)
        Q = random_point(curve)
        R = add(P,Q)

    xp = P[0]
    yp = P[1]
    m = R[2]
    x_line = np.linspace(-5, 20, 100000)
    y_line = m*(x-xp) + yp
    ax.plot(x_line,y_line,linewidth=2.0,color='blue')
    ax.vlines(R[0],-R[1],R[1],linewidth=2.0,color='pink')
    ax.annotate('P',xy=P)
    ax.annotate('Q',xy=Q)
    ax.annotate('R',xy=(R[0],-R[1]))
    ax.annotate("-R",xy=(R[0],R[1]))

    ax.set_title('y^2 = x^3 + {}x + {}'.format(a,b))
    ax.set(xlim=(-3, max(6,abs(R[0]+3))),ylim=(-max(abs(R[1])+3,6), max(abs(R[1])+3,6)))
    t = "P=({:.3f},{:.3f})\nQ=({:.3f},{:.3f})\n-R=({:.3f},{:.3f})".format(P[0],P[1],Q[0],Q[1],R[0],R[1])
    print(t)
    plt.text(-2, 3, t, ha='left', wrap=True)

def plot_random_double(curve):
    a = curve[0]
    b = curve[1]

    # make data
    x = np.linspace(-5, 20, 100000)
    y = np.sqrt(x**3 + a*x + b)
    y2 = -np.sqrt(x**3 + a*x + b)

    # plot
    fig, ax = plt.subplots()

    # plot curve
    ax.plot(x, y, linewidth=2.0, color='red')
    ax.plot(x, y2, linewidth=2.0, color='red')
    R=(300,300)
    while(R[0]>20):
        P = random_point(curve)
        R = double(P,curve)

    xp = P[0]
    yp = P[1]
    m = R[2]
    x_line = np.linspace(-5, 20, 100000)
    y_line = m*(x-xp) + yp
    ax.plot(x_line,y_line,linewidth=2.0,color='blue')
    ax.vlines(R[0],-R[1],R[1],linewidth=2.0,color='pink')
    ax.annotate('P',xy=P)
    ax.annotate('R',xy=(R[0],-R[1]))
    ax.annotate("-R",xy=(R[0],R[1]))

    ax.set_title('y^2 = x^3 + {}x + {}'.format(a,b))
    ax.set(xlim=(-3, max(6,abs(R[0]+3))),ylim=(-max(abs(R[1])+3,6), max(abs(R[1])+3,6)))
    t = "P=({:.3f},{:.3f})\n-R=({:.3f},{:.3f})".format(P[0],P[1],R[0],R[1])
    print(t)
    plt.text(-2, 3, t, ha='left', wrap=True)

curve = (-3,1)
plot_random_add(curve)
标量乘法
import matplotlib.pyplot as plt
import numpy as np
import warnings
warnings.filterwarnings("ignore")

def random_point(curve):
    a = curve[0]
    b = curve[1]
    y=-1
    x=-1
    s = -1
    while(y<0):
        x = np.random.rand()*6-3
        y = x**3 + a*x+b
        s = s*-1
    return (x,s*np.sqrt(y))

def add(P,Q,curve):
    xp = P[0]
    yp = P[1]
    xq = Q[0]
    yq = Q[1]
    if(P[0]==0):
        return Q
    if(Q[0]==0):
        return P
    if(P[0]==Q[0]):
        if(P[1]==Q[1]):
            return double(P,curve)
        else:
            return (0,0)
    m = (yp-yq)/(xp-xq)
    xr = m**2 - xp-xq
    yr = yp+m*(xr-xp)
    return (xr,-yr,m)

def double(P,curve):
    a = curve[0]
    b = curve[1]
    xp = P[0]
    yp = P[1]
    m = (3*xp**2 +a)/(2*yp)
    xr = m**2 - 2*xp
    yr = yp+m*(xr-xp)
    return (xr,-yr,m)

def bits(n):
    """
    Generates the binary digits of n, starting
    from the least significant bit.

    bits(151) -> 1, 1, 1, 0, 1, 0, 0, 1
    """
    while n:
        yield n & 1
        n >>= 1

def scalar_mult(n, P,curve):
    """
    Returns the result of n * x, computed using
    the double and add algorithm.
    """
    result = (0,0)
    addend = P

    for bit in bits(n):
        if bit == 1:
            result = add(result,addend,curve)
        addend = double(addend,curve)

    return result

def plot_random_scalar_mult(curve):
    a = curve[0]
    b = curve[1]

    # make data
    x = np.linspace(-5, 20, 100000)
    y = np.sqrt(x**3 + a*x + b)
    y2 = -np.sqrt(x**3 + a*x + b)

    # plot
    fig, ax = plt.subplots()

    # plot curve
    ax.plot(x, y, linewidth=2.0, color='red')
    ax.plot(x, y2, linewidth=2.0, color='red')
    R=(300,300)
    n = 3
    while(R[0]>20):
        P = random_point(curve)
        R = scalar_mult(n,P,curve)

    ax.annotate('P',xy=P)
    ax.annotate("-R",xy=(R[0],R[1]))

    ax.set_title('y^2 = x^3 + {}x + {},R={}P'.format(a,b,n))
    ax.set(xlim=(-3, max(6,abs(R[0]+3))),ylim=(-max(abs(R[1])+3,6), max(abs(R[1])+3,6)))
    t = "P=({:.3f},{:.3f})\n-R=({:.3f},{:.3f})".format(P[0],P[1],R[0],R[1])
    print(t)
    plt.text(-2, 3, t, ha='left', wrap=True)

curve = (-3,4)
plot_random_scalar_mult(curve)
总结:
这里介绍了实数上面的椭圆曲线,接下来会介绍整数域上面的椭圆曲线,也是密码学中常提到的椭圆曲线。


