数据科学【二】基本可视化(一)
数据科学【二】基本可视化
本文章中示例代码在第一篇(https://blog.csdn.net/swy_swy_swy/article/details/124763216)的基础上实现。
条形图
使用barh函数
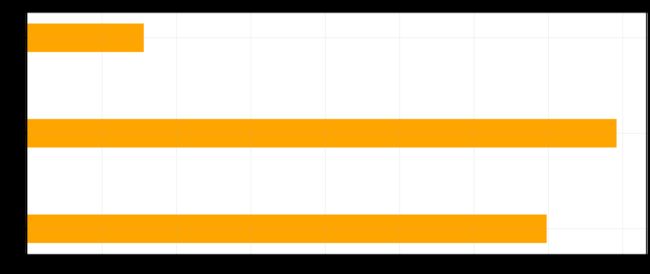
绘制是否存活的平均年龄
sur_avg = df[df.Survived==1]['Age'].mean()
dead_avg = df[df.Survived==0]['Age'].mean()
from matplotlib import pyplot as plt
import matplotlib

labels = ['survive', 'not survive']
datas = [sur_avg, dead_avg]

plt.figure(figsize=(20, 8), dpi=80)
plt.barh(range(2), datas, height=0.3, color='orange')
plt.yticks(range(2), labels)
plt.grid(alpha=0.3)

plt.ylabel("Survive or not")
plt.xlabel("Average Age")
plt.title("Average Age of Survivors & Victims")

plt.show()
绘制不同性别的存活率
df1 = df[df.Survived==1]
survive_male_cnt = df1[df1.Sex==0].shape[0]
all_male_cnt = df[df.Sex==0].shape[0]
survive_female_cnt = df1[df1.Sex==1].shape[0]
all_female_cnt = df[df.Sex==1].shape[0]

male_proportion = survive_male_cnt/all_male_cnt
female_proportion = survive_female_cnt/all_female_cnt

labels = ['Male', 'Female']
datas = [male_proportion, female_proportion]

plt.figure(figsize=(20, 8), dpi=80)
plt.barh(range(2), datas, height=0.3, color='orange')
plt.yticks(range(2), labels)
plt.grid(alpha=0.3)

plt.ylabel("Gender")
plt.xlabel("Survive Proportion")
plt.title("Survive Proportion of Different Genders")

plt.show()
绘制不同头衔的存活率
survive_df = df[df.Survived==1]
miss_survive_cnt = survive_df[survive_df.Title=='Miss'].shape[0]
ms_survive_cnt = survive_df[survive_df.Title=='Mrs'].shape[0]
mr_survive_cnt = survive_df[survive_df.Title=='Mr'].shape[0]

miss_cnt = df[df.Title=='Miss'].shape[0]
ms_cnt = df[df.Title=='Mrs'].shape[0]
mr_cnt = df[df.Title=='Mr'].shape[0]

miss_p = miss_survive_cnt/miss_cnt
ms_p = ms_survive_cnt/ms_cnt
mr_p = mr_survive_cnt/mr_cnt

labels = ['Miss', 'Mrs', 'Mr']
datas = [miss_p, ms_p, mr_p]

plt.figure(figsize=(20, 8), dpi=80)
plt.barh(range(3), datas, height=0.3, color='orange')
plt.yticks(range(3), labels)
plt.grid(alpha=0.3)

plt.ylabel("Title")
plt.xlabel("Survive Proportion")
plt.title("Survive Proportion for Different Titles")

plt.show()
是否存活的平均票价
avg_sur = df[df.Survived==1]['Fare'].mean()
avg_dead = df[df.Survived==0]['Fare'].mean()

labels = ['Survivors', 'Victims']
datas = [avg_sur, avg_dead]

plt.figure(figsize=(20, 8), dpi=80)
plt.barh(range(2), datas, height=0.3, color='orange')
plt.yticks(range(2), labels)
plt.grid(alpha=0.3)

plt.ylabel("Survive or not")
plt.xlabel("Average Fare")
plt.title("Average Fare for Survivors and Victims")

plt.show()
绘制箱型图
使用boxplot函数
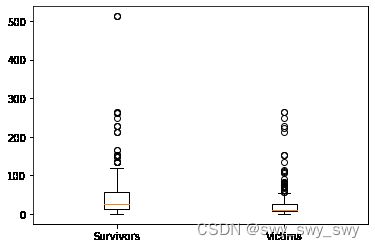
绘制是否存活的票价分布
plt.boxplot(x=[df[df.Survived==1]['Fare'], df[df.Survived==0]['Fare']], labels=['Survivors', 'Victims'])
plt.show()


