前言:
数据可视化就是将数据转换成图或表等,以一种更直观的方式展现和呈现数据。通过“可视化”的方式,我们看不懂的数据通过图形化的手段进行有效地表达,准确高效、简洁全面地传递某种信息,甚至我们帮助发现某种规律和特征,挖掘数据背后的价值。现在,提出一种方案,基于springboot框架,将excel表格中的数据提取出来,前端使用echarts框架,通过柱形图和饼状图对数据进行直观展示
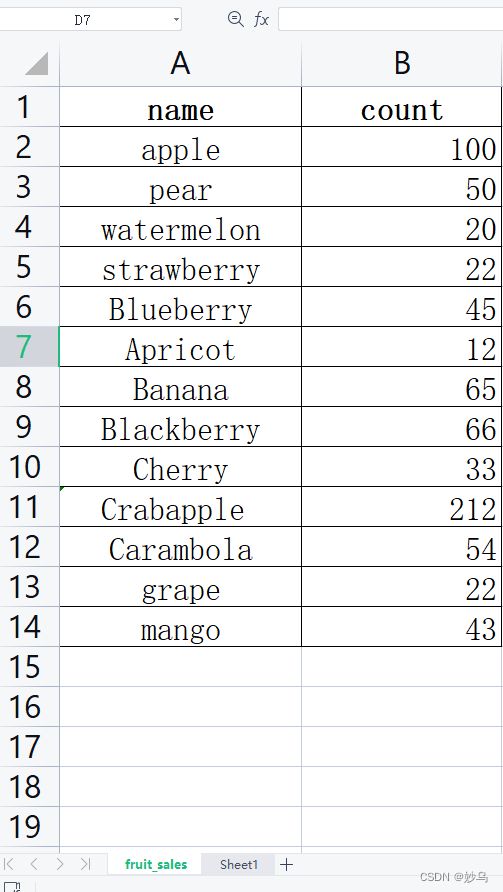
Excel数据源展示
创建Registration.xlsx表格和fruit_sales页面,同时创建相关水果销售数据
结构一览
⚽️ echarts,min.js下载链接
一、读取Excel表格中的数据
本项目使用springboot整合hutool第三方类库实现对excel文件中数据采用流的方式进行读取,详情参看hutool官方文档
Hutool官方文档链接
1.1 创建springboot工程,导入相关依赖
            cn.hutool
            hutool-all
            5.4.7


            org.apache.poi
            poi
            3.16


            org.apache.poi
            poi-ooxml
            3.16
1.2 创建测试类TestExcel
package com.allin.data_view;

import cn.hutool.poi.excel.ExcelReader;
import cn.hutool.poi.excel.ExcelUtil;
import org.apache.poi.util.IOUtils;
import org.junit.Test;
import org.springframework.mock.web.MockMultipartFile;
import org.springframework.web.multipart.MultipartFile;

import java.io.File;
import java.io.FileInputStream;
import java.io.InputStream;
import java.util.List;
import java.util.Map;
import java.util.Set;

public class TestExcel {

    @Test
    public  void test() throws Exception{
        File file = new File("D:\\2022learn\\springboot-test\\springboot-office\\data_view\\Registration.xlsx");

        FileInputStream input = new FileInputStream(file);

        MultipartFile multipartFile =new MockMultipartFile("file", file.getName(), "text/plain", IOUtils.toByteArray(input));
        // 1.获取上传文件输入流
        InputStream inputStream = null;
        try{
            inputStream = multipartFile.getInputStream();
        }catch (Exception e){
        }
        // 2.应用HUtool ExcelUtil获取ExcelReader指定输入流和sheet
        ExcelReader excelReader = ExcelUtil.getReader(inputStream, "fruit_sales");
        // 可以加上表头验证
        // 3.读取第二行到最后一行数据
        //List> read = excelReader.read(1, excelReader.getRowCount());
        List> read = excelReader.readAll();
        for (Map objects : read) {
            Set keys = objects.keySet();
            for(String key:keys){
                System.out.println(key + ":" + objects.get(key));
            }
            System.out.println();
        }
    }
}
测试结果:
二、采用柱形图显示Excel表格数据
2.1 前端代码
在springboot框架中创建index.html,使用ajax动态获取后端数据
echarts-bar
2.2 后端代码
2.2.1 Controller层代码
前端代码会发送list请求到后端请求数据,controller层响应请求,通过service层获取表格数据,返回map类型的数据
package com.allin.controller;

import com.allin.service.GetDataFromExcel;
import org.springframework.beans.factory.annotation.Autowired;
import org.springframework.stereotype.Controller;
import org.springframework.web.bind.annotation.RequestMapping;
import org.springframework.web.bind.annotation.RequestMethod;
import org.springframework.web.bind.annotation.ResponseBody;

import java.util.HashMap;
import java.util.List;
import java.util.Map;

@Controller
@RequestMapping(value = "/")
public class IndexController {

    @Autowired
    private GetDataFromExcel getDataFromExcel;

    @RequestMapping(value = "", method = RequestMethod.GET)
    public String index(){
        return "index";
    }

    @RequestMapping(value = "list", method = RequestMethod.GET)
    @ResponseBody
    public Map getList() throws Exception {
        Map map = new HashMap<>();
        List> list = getDataFromExcel.getData();
        map.put("msg","ok");
        map.put("data",list);
        list.forEach(System.out::println);

        return map;
    }
}
2.1.3 Service层代码
在service包下创建GetDataFromExcel类用于从Excel表格中获取数据
package com.allin.service;

import cn.hutool.poi.excel.ExcelReader;
import cn.hutool.poi.excel.ExcelUtil;
import org.apache.poi.util.IOUtils;
import org.springframework.mock.web.MockMultipartFile;
import org.springframework.stereotype.Service;
import org.springframework.web.multipart.MultipartFile;

import java.io.File;
import java.io.FileInputStream;
import java.io.InputStream;
import java.util.List;
import java.util.Map;

@Service
public class GetDataFromExcel {
    public List> getData() throws Exception{
        File file = new File("D:\\2022learn\\springboot-test\\springboot-office\\data_view\\Registration.xlsx");

        FileInputStream input = new FileInputStream(file);

        MultipartFile multipartFile =new MockMultipartFile("file", file.getName(), "text/plain", IOUtils.toByteArray(input));
        // 1.获取上传文件输入流
        InputStream inputStream = null;
        try{
            inputStream = multipartFile.getInputStream();
        }catch (Exception e){
        }
        // 2.应用HUtool ExcelUtil获取ExcelReader指定输入流和sheet
        ExcelReader excelReader = ExcelUtil.getReader(inputStream, "fruit_sales");
        // 可以加上表头验证
        // 3.读取第二行到最后一行数据
        //List> read = excelReader.read(1, excelReader.getRowCount());
        List> read = excelReader.readAll();
        return read;
    }
}
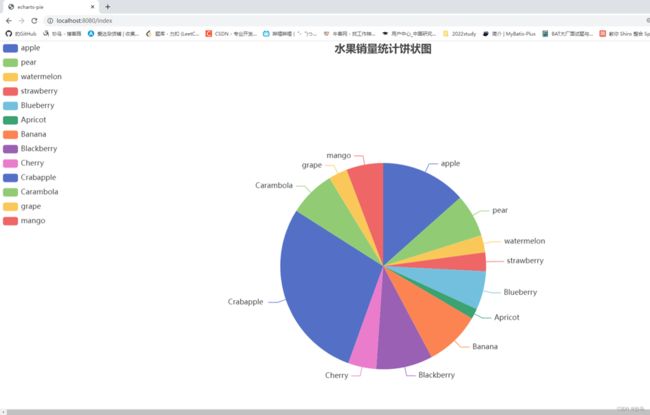
三、采用饼状图显示Excel表格数据
3.1 前端代码
在springboot框架中创建index1.html,使用ajax动态获取后端数据
echarts-pie
3.2 后端代码
因与柱状图获取数据来源一样,故Controller层与Service层代码同柱状图
参考资料
Echarts 动态加载数据库中的数据
Hutool读取Excel内容
到此这篇关于基于springboot实现数据可视化的文章就介绍到这了,更多相关基于springboot实现数据可视化内容请搜索脚本之家以前的文章或继续浏览下面的相关文章希望大家以后多多支持脚本之家!


