【5】matplotlib绘制光滑的曲线来拟合散点图
matplotlib绘制光滑的曲线来拟合散点图
- 基本思想
- 1.法1
- 2.法2
基本思想
其实就是找到原来散点图x和y的对应关系,然后通过大量的采样点来拟合来近似曲线。
1.法1
这个方法网上有很多blog,但是问题是它使用的函数在新版的matplotlib里已经没了(可能换名字了,我也没查)。不过还是转载过来一下。转自:原blog
使用scipy库可以拟合曲线.
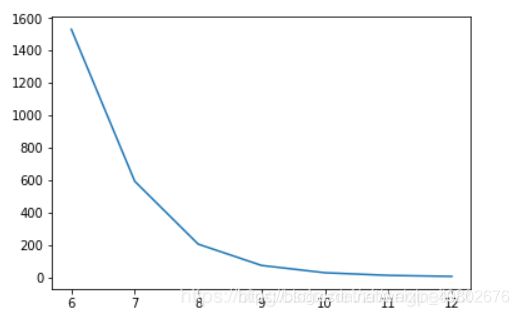
没拟合的图:
import matplotlib.pyplot as plt
import numpy as np
T = np.array([6, 7, 8, 9, 10, 11, 12])
power = np.array([1.53E+03, 5.92E+02, 2.04E+02, 7.24E+01, 2.72E+01, 1.10E+01, 4.70E+00])
plt.plot(T,power)
plt.show()
import matplotlib.pyplot as plt
import numpy as np
T = np.array([6, 7, 8, 9, 10, 11, 12])
power = np.array([1.53E+03, 5.92E+02, 2.04E+02, 7.24E+01, 2.72E+01, 1.10E+01, 4.70E+00])

from scipy.interpolate import spline  # 如果你的matplotlib版本较新,这个会报错
xnew = np.linspace(T.min(),T.max(),300) #300 represents number of points to make between T.min and T.max
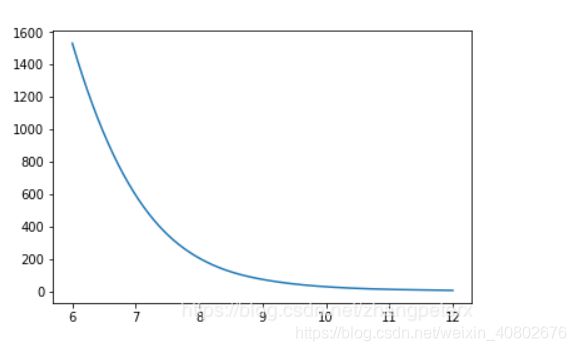
power_smooth = spline(T,power,xnew)
plt.plot(xnew,power_smooth)
plt.show()
2.法2
使用:scipy.interpolate.interp1d
import numpy as np
from scipy.interpolate import interp1d
import matplotlib.pyplot as plt

x = np.array([6, 7, 8, 9, 10, 11, 12])
y = np.array([1.53E+03, 5.92E+02, 2.04E+02, 7.24E+01, 2.72E+01, 1.10E+01, 4.70E+00])

xnew = np.linspace(x.min(),x.max(),300)

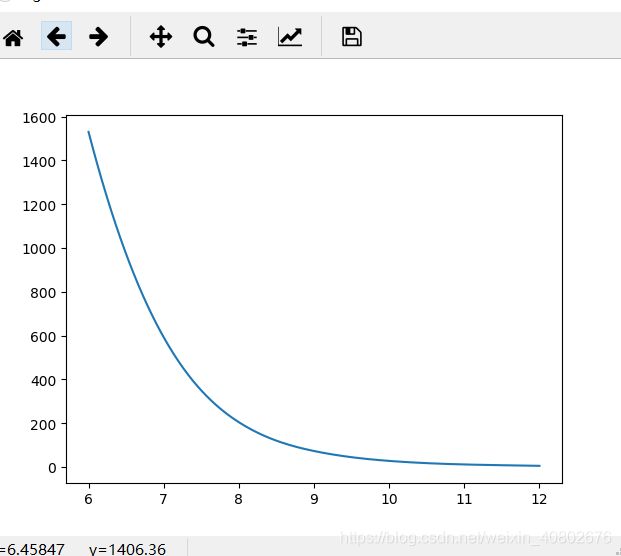
func = interp1d(x,y,kind='cubic')

ynew = func(xnew)

plt.plot(xnew,ynew)  # 此时即为平滑曲线

