人工智能②——逻辑回归与鸢尾花集
目 录
一. 手推实现逻辑回归梯度下降
二. 用逻辑回归实现鸢尾花数据集分类
1. 鸢尾花数据集的简介
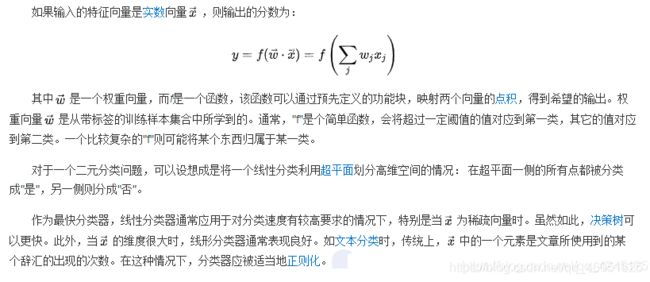
2. 什么是线性分类器
3. 设计线性分类器的主要步骤
4. 逻辑回归(LogisticRegression)的粗略定义
5. 逻辑回归模型中sklearn的使用
6. 线性多分类的实现
7. 相关代码
正 文
一. 手推实现逻辑回归梯度下降(图片如下)
二. 用逻辑回归实现鸢尾花数据集分类
1. 鸢尾花数据集简介
鸢尾花数据集作为入门经典数据集,Iris数据集是常用的分类实验数据集,由Fisher,1936 收集整理。Iris也称鸢尾花卉数据集,是一类多重变量分析的数据集。Iris鸢尾花数据集是 一个经典的数据集。 包含3类共150条记录,每类各50项数据,每一条记录都有四个体征。 2. 线性分类器介绍
线性分类器就是用一个“超平面”将正、负样本隔离开,如:
(1)二维平面上的正、负样本用一条直线来进行分类;
(2)三维立体空间内的正、负样本用一个平面来进行分类;
(3)N维空间内的正负样本用一个超平面来进行分类;
常见的线性分类器有:LR,贝叶斯分类,单层感知机、线性回归,SVM(线性核)等
①.收集一组具有类别标志的样本X={x1,x2,…,xN}
②.按需要确定一准则函数J,其值反映分类器的性能,其极值解对应于“最好”的决策
③.用最优化技术求准则函数J的极值解w* 和w0* ,从而确定判别函数,完成分类器设计
④.得到线性判别函数g(x)=wT+w0或g(x)=a*Ty、对于未知样本x,计算g(x),判断其类别
四. 逻辑回归的粗略定义
逻辑回归(Logistic Regression)是用于处理因变量为分类变量的回归问题,常见的是二 分 类或二项分布问题,也可以处理多分类问题(其实是一种概率模型).
五. 逻辑回归模型中Sklearn的使用
1). 导入模型
from sklearn.linear_model import LogisticRegression #导入逻辑回归模型
2). fit()训练 注意:调用fit(x,y)的方法来训练模型,其中x为数据的属性,y为所属类型
clf = LogisticRegression()
print(clf)
clf.fit(train_feature,label)
3). 预测(用训练得到的模型进行预测)
predict['label'] = clf.predict(predict_feature)
六. 线性多分类的实现
1). 使用Jupyter Notebook进行线性分类(Anaconda)
2). 多分类的线性代码编写
①导入所需的函数库
#导入所需的函数库
import numpy as np
from sklearn.linear_model import LogisticRegression
import matplotlib.pyplot as plt
import matplotlib as mpl
from sklearn import datasets
from sklearn import preprocessing
import pandas as pd
from sklearn.preprocessing import StandardScaler
from sklearn.pipeline import Pipeline
② 获取鸢尾花数据集
# 获取所需数据集
iris=datasets.load_iris()
#每行的数据,一共四列,每一列映射为feature_names中对应的值
X=iris.data
print(X)
#每行数据对应的分类结果值(也就是每行数据的label值),取值为[0,1,2]
Y=iris.target
print(Y)
③数据处理
#归一化处理
X = StandardScaler().fit_transform(X)
print(X)
④训练模型(利用fit()函数训练)
lr = LogisticRegression()   # Logistic回归模型
lr.fit(X, Y)        # 根据数据[x,y],计算回归参数
⑤绘制图形(散点图)
N, M = 500, 500     # 横纵各采样多少个值
x1_min, x1_max = X[:, 0].min(), X[:, 0].max()   # 第0列的范围
x2_min, x2_max = X[:, 1].min(), X[:, 1].max()   # 第1列的范围
t1 = np.linspace(x1_min, x1_max, N)
t2 = np.linspace(x2_min, x2_max, M)
x1, x2 = np.meshgrid(t1, t2)                    # 生成网格采样点
x_test = np.stack((x1.flat, x2.flat), axis=1)   # 测试点

cm_light = mpl.colors.ListedColormap(['#77E0A0', '#FF8080', '#A0A0FF'])
cm_dark = mpl.colors.ListedColormap(['g', 'r', 'b'])
y_hat = lr.predict(x_test)       # 预测值
y_hat = y_hat.reshape(x1.shape)                 # 使之与输入的形状相同
plt.pcolormesh(x1, x2, y_hat, cmap=cm_light)     # 预测值的显示
plt.scatter(X[:, 0], X[:, 1], c=Y.ravel(), edgecolors='k', s=50, cmap=cm_dark)
plt.xlabel('petal length')
plt.ylabel('petal width')
plt.xlim(x1_min, x1_max)
plt.ylim(x2_min, x2_max)
plt.grid()
plt.show()
⑥预测模型
y_hat = lr.predict(X)
Y = Y.reshape(-1)
result = y_hat == Y
print(y_hat)
print(result)
acc = np.mean(result)
print('准确度: %.2f%%' % (100 * acc))
⑦完整代码及结果展示
代码行
#导入相关包
import numpy as np
from sklearn.linear_model import LogisticRegression
import matplotlib.pyplot as plt
import matplotlib as mpl
from sklearn import datasets
from sklearn import preprocessing
import pandas as pd
from sklearn.preprocessing import StandardScaler
from sklearn.pipeline import Pipeline
# 获取所需数据集
iris = datasets.load_iris()
#每行的数据,一共四列,每一列映射为feature_names中对应的值
X = iris.data
print(X)
#每行数据对应的分类结果值(也就是每行数据的label值),取值为[0,1,2]
Y = iris.target
print(Y)
#归一化处理
X = StandardScaler().fit_transform(X)
print(X)
lr = LogisticRegression()   # Logistic回归模型
lr.fit(X, Y)        # 根据数据[x,y],计算回归参数
N, M = 500, 500     # 横纵各采样多少个值
x1_min, x1_max = X[:, 0].min(), X[:, 0].max()   # 第0列的范围
x2_min, x2_max = X[:, 1].min(), X[:, 1].max()   # 第1列的范围
t1 = np.linspace(x1_min, x1_max, N)
t2 = np.linspace(x2_min, x2_max, M)
x1, x2 = np.meshgrid(t1, t2)                    # 生成网格采样点
x_test = np.stack((x1.flat, x2.flat), axis=1)   # 测试点
cm_light = mpl.colors.ListedColormap(['#77E0A0', '#FF8080', '#A0A0FF'])
cm_dark = mpl.colors.ListedColormap(['g', 'r', 'b'])
y_hat = lr.predict(x_test)       # 预测值
y_hat = y_hat.reshape(x1.shape)                 # 使之与输入的形状相同
plt.pcolormesh(x1, x2, y_hat, cmap=cm_light)     # 预测值的显示
plt.scatter(X[:, 0], X[:, 1], c=Y.ravel(), edgecolors='k', s=50, cmap=cm_dark)
plt.xlabel('petal length')
plt.ylabel('petal width')
plt.xlim(x1_min, x1_max)
plt.ylim(x2_min, x2_max)
plt.grid()
plt.show()
y_hat = lr.predict(X)
Y = Y.reshape(-1)
result = y_hat == Y
print(y_hat)
print(result)
acc = np.mean(result)
print('准确度: %.2f%%' % (100 * acc))
结果展示
机器学习——鸢尾花数据集的线性多分类_Harriet的博客-CSDN博客


