Python——时间序列的可视化、日期显示格式
一、时间序列
时间序列(或称动态数列)是指将同一统计指标的数值按其发生的时间先后顺序排列而成的数列。
时间序列数据本质上反映的是某个或者某些随机变量随时间不断变化的趋势,而时间序列预测方法的核心就是从数据中挖掘出这种规律,并利用其对将来的数据做出估计。
二、python中日期显示的格式
import datetime
y=datetime.datetime.now()
print(y)   #显示年月日,时分秒微秒   2020-06-09 09:48:20.113005
print(y.strftime('%Y-%m-%d %H:%M:%S'))    #2020-06-09 09:48:20
print(y.year)  #显示年  2020
print(y.strftime("%A"))  #显示Tuesday
print(y.strftime("%a"))  #显示Tue
print(y.strftime("%w"))  #显示数字0-6,0为周日  2
print(y.strftime("%d"))   #显示数字01-31 那一月的哪一天   09
print(y.strftime("%b"))   #月名称,短     Jun
print(y.strftime("%B"))   #显示月份长    June
print(y.strftime("%m"))   #显示月01-12    06
print(y.strftime("%y"))   #显示年短    20
print(y.strftime("%Y"))   #显示年     2020
print(y.strftime("%H"))   #显示小时00-23   09
print(y.strftime("%I"))   #显示小时00-12    09
三、可视化——折线图
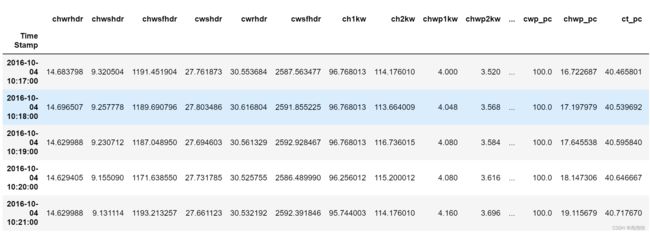
在进行数据可视化的时候,在读入数据的时候我们可以进行这一步操作(列转换为DatetimeIndex格式,:
data_=pd.read_csv('C:/Users/bwy/Desktop/创新创业C题/数据/B题-附件1:CACS_data_1.csv',parse_dates=True, index_col = "Time Stamp")
import pandas as pd
import matplotlib.pyplot as plt
import matplotlib as mpl
#处理中文乱码
plt.rcParams['font.sans-serif'] = ['Microsoft YaHei']
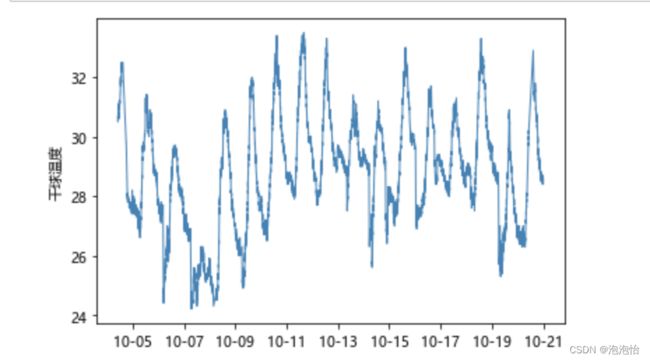
# 绘制单条折线图
plt.plot(
         data['drybulb'], # y轴数据
         linestyle = '-', # 折线类型
         linewidth = 2, # 折线宽度
         color = 'steelblue' # 折线颜色
         )
plt.ylabel('干球温度')
# 获取图的坐标信息
ax = plt.gca()
# 设置日期的显示格式
date_format = mpl.dates.DateFormatter("%m-%d")
ax.xaxis.set_major_formatter(date_format)
# 显示图形
plt.show()
结果:
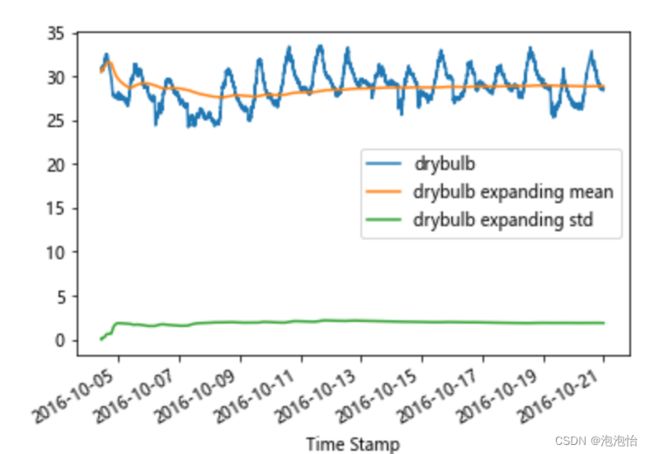
四、可视化——扩展窗口
fig, ax = plt.subplots()
ax = data.drybulb.plot(label='drybulb')
ax = data.drybulb.expanding().mean().plot(label='drybulb expanding mean')
ax = data.drybulb.expanding().std().plot(label='drybulb expanding std')
ax.legend()
结果:


