深度学习——以CNN服装图像分类为例,探讨怎样评价神经网络模型
活动地址:CSDN21天学习挑战赛
目录
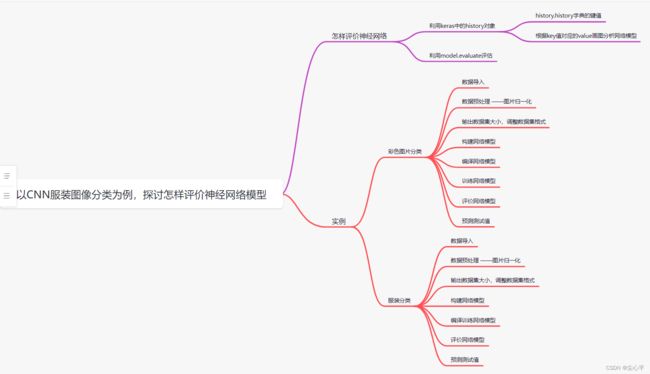
怎样评价神经网络
利用keras中的history对象
history.history字典的键值
根据key值对应的value画图分析网络模型
利用model.evaluate评估
实例
彩色图片分类
数据导入
数据预处理 ——图片归一化
输出数据集大小,调整数据集格式
构建网络模型
编译网络模型
训练网络模型
评价网络模型
预测测试值
服装分类
数据导入
数据预处理——图像归一化
数据格式调整
构建网络模型
编译训练网络模型
评价网络模型
预测测试集
怎样评价神经网络
利用keras中的history对象
keras中的类History对象有两个属性 history 和 epoch
history.epoch返回一个列表,列表的值是 0 ~ 训练时指定的epoch
history.history返回一个字典,字典有4个键值key,分别是accuracy、val_accuracy、loss和val_loss,每个key的value均是一个列表,列表的长度=history.epoch的长度=模型训练时指定的epoch数
这里我们用到的主要是history.history的4个键值,下面详细介绍
history.history字典的键值
首先我们来介绍一下训练集train_set和测试集test_set (实际上还有一个用的不多的验证集validation set)
训练集是参与网络模型训练的数据集
测试集是对网络模型的性能进行评估的数据集,一般不参与网络模型的训练
验证集是用来用来调整网络超参数的数据集(用的不多)
一般来说整个数据集中训练集和测试集的比例是7:3,有验证集时的比例是6:2:2
accuracy和loss均是描述训练集的
- accuracy是每轮训练,训练集的准确度
- loss是每轮训练,训练集的损失程度
val_accuracy和val_loss均是描述验证集的
但验证集一般不怎么用,一般是用测试集代替验证集,所以才有了训练模型fit函数内的validation_data参数传的是测试集,故这两个对象代表的也可以是测试集
- val_accuracy是每轮训练,验证集的准确度
- val_loss是每轮训练,验证集的损失程度
根据key值对应的value画图分析网络模型
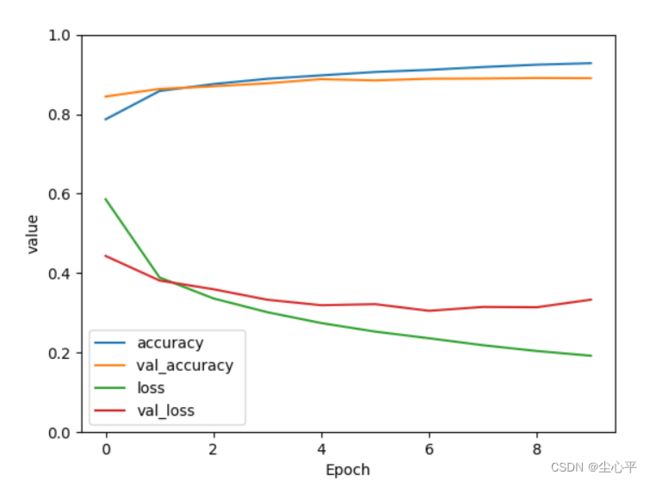
这4个键对应的值恰好是每次训练得到的loss、accuracy、val_loss、val_accuracy,如下图
每轮训练得到的loss、accuracy、val_loss、val_accuracy是通过编译网络模型时指定的计算方法计算的:
可以利用 matplotlib.pyplot 库绘画出这4条线的变化,具体代码如下:
plt.plot(history.history['accuracy'], label='accuracy')  # 训练集准确度
plt.plot(history.history['val_accuracy'], label='val_accuracy ')  # 验证集准确度
plt.plot(history.history['loss'], label='loss')  # 训练集损失程度
plt.plot(history.history['val_loss'], label='val_loss')  # 验证集损失程度
plt.xlabel('Epoch')  # 训练轮数
plt.ylabel('value')  # 值
plt.ylim([0, 1])  #  y轴表示范围
plt.legend(loc='lower left')  # 图例位置
plt.show()
下面是示例图:
由折线整体变化趋势分析
利用model.evaluate评估
该函数会接受测试集数据,输出测试集的loss和accuray值(accuracy只有compile时指定metrics才会有)
实例
彩色图片分类
数据导入
import tensorflow as tf
from keras import datasets, models, layers  # keras
import matplotlib.pyplot as plt
#导入数据集
(train_images, train_labels), (test_images, test_labels) =tf.keras.datasets.cifar10.load_data()  # datasets内部集成了彩色图片数据集,
数据预处理 ——图片归一化
# 归一化
# 将像素的值标准化至0到1的区间内,rgb像素值 0~255 0为黑 1为白
train_images, test_images = train_images / 255.0, test_images / 255.0
输出数据集大小,调整数据集格式
print(train_images.size)  # 153600000
print(test_images.size)  # 30720000
# 换算
# 彩色说明3通道 32*32的图片
train_images = train_images.reshape((-1, 32, 32, 3))
test_images = test_images.reshape((-1, 32, 32, 3))
构建网络模型
经过多次测试,从两层卷积池化到三层卷积池化到两次卷积池化+Dropout到三层卷积池化Dropout,多次评价模型,最好的情况是在三层卷积池化+Dropout(0.3)
代码如下:
# 构建CNN网络模型
model = models.Sequential([  # 采用Sequential 顺序模型
    layers.Conv2D(32, (3, 3), activation='relu', input_shape=(32, 32, 3)),
    # 卷积层1,卷积核个数32,卷积核3*3*3 relu激活去除负值保留正值,输入是32*32*3
    layers.MaxPooling2D((2, 2)),  # 池化层1,2*2采样

    layers.Conv2D(64, (3, 3), activation='relu'),
    # 卷积层2,卷积核64个,卷积核3*3*3,relu激活去除负值保留正值
    layers.MaxPooling2D((2, 2)),  # 池化层2,2*2采样

    layers.Conv2D(64, (3, 3), activation='relu'),
    # 卷积层2,卷积核64个,卷积核3*3*3,relu激活去除负值保留正值
    layers.MaxPooling2D((2, 2)),  # 池化层2,2*2采样

    layers.Flatten(),  # Flatten层,连接卷积层与全连接层
    layers.Dropout(0.3),# 设置Dropout层
    layers.Dense(64, activation='relu'),  # 全连接层,64张特征图,特征进一步提取
    layers.Dense(10)  # 输出层,输出预期结果
])
# 打印网络结构
model.summary()
编译网络模型
# 编译
model.compile(optimizer='adam',  # 优化器
              loss=tf.keras.losses.SparseCategoricalCrossentropy(from_logits=True),
              # 设置损失函数from_logits: 为True时,会将y_pred转化为概率
              metrics=['accuracy'])
训练网络模型
# 训练
# epochs为训练轮数
history = model.fit(train_images, train_labels, epochs=10,
                    validation_data=(test_images, test_labels))
评价网络模型
绘制loss、val_loss、accuracy、val_accuracy折线图
# 评价
plt.plot(history.history['accuracy'], label='accuracy')  # 精确度
plt.plot(history.history['val_accuracy'], label='val_accuracy ')
plt.plot(history.history['loss'], label='loss')
plt.plot(history.history['val_loss'], label='val_loss')
plt.xlabel('Epoch')  # 循环次数
plt.ylabel('value')
plt.ylim([0, 1.5])
plt.legend(loc='lower right')
plt.show()

test_loss, test_acc = model.evaluate(test_images, test_labels, verbose=1)  # loss函数的值和 metrics值
# 输入数据和标签,输出损失值和选定的指标值(如精确度accuracy)
print(test_loss, test_acc)
# 313/313 [==============================] - 1s 2ms/step - loss: 0.8412 - accuracy: 0.7079
# 0.8412009477615356 0.7078999876976013
val_loss与loss均逐渐下降,属于最好的情况
预测测试值
# 绘制测试集图片
class_names = ['airplane', 'automobile', 'bird', 'cat', 'deer', 'dog', 'frog', 'horse', 'ship', 'truck']
plt.figure(figsize=(20, 10))  # 这里只看20张,实际上并不需要可视化图片这一步骤
for i in range(20):
    plt.subplot(5, 10, i + 1)
    plt.xticks([])
    plt.yticks([])
    plt.grid(False)
    plt.imshow(test_images[i], cmap=plt.cm.binary)
    plt.xlabel(class_names[test_labels[i][0]])
plt.show()

# 预测
pre = model.predict(test_images)  # 对所有测试图片进行预测
for x in range(5):
    print(pre[x])
for x in range(5):
    print(class_names[np.array(pre[x]).argmax()])
运行输出
得到结论是相符合
服装分类
数据导入
# 导入数据集
(train_images, train_labels), (test_images, test_labels) = tf.keras.datasets.fashion_mnist.load_data()  # datasets内部集成了MNIST数据集
数据预处理——图像归一化
# 归一化
# 将像素的值标准化至0到1的区间内,rgb像素值 0~255 0为黑 1为白
train_images, test_images = train_images / 255.0, test_images / 255.0
数据格式调整
# 这里图片的格式是28*28,通道数为1
train_images = train_images.reshape((-1, 28, 28, 1))
test_images = test_images.reshape((-1, 28, 28, 1))
构建网络模型
这里采用了边缘填充0,3层卷积池化
# 构建CNN网络模型
model = models.Sequential([  # 采用Sequential 顺序模型
    layers.Conv2D(32, (3, 3), activation='relu', input_shape=(28, 28, 1),padding='same'),
    # 卷积层1,卷积核个数32,卷积核3*3*1 relu激活去除负值保留正值,输入是28*28*1
    layers.MaxPooling2D((2, 2)),  # 池化层1,2*2采样

    layers.Conv2D(64, (3, 3), activation='relu'),
    # 卷积层2,卷积核64个,卷积核3*3,relu激活去除负值保留正值
    layers.MaxPooling2D((2, 2)),  # 池化层2,2*2采样

    layers.Conv2D(64, (3, 3), activation='relu'),
    # 卷积层3,卷积核64个,卷积核3*3,relu激活去除负值保留正值
    layers.MaxPooling2D((2, 2)),  # 池化层2,2*2采样

    layers.Flatten(),  # Flatten层,连接卷积层与全连接层
    layers.Dropout(0.3),
    layers.Dense(64, activation='relu'),  # 全连接层,64张特征图,特征进一步提取
    layers.Dense(10)  # 输出层,输出预期结果
])
# 打印网络结构
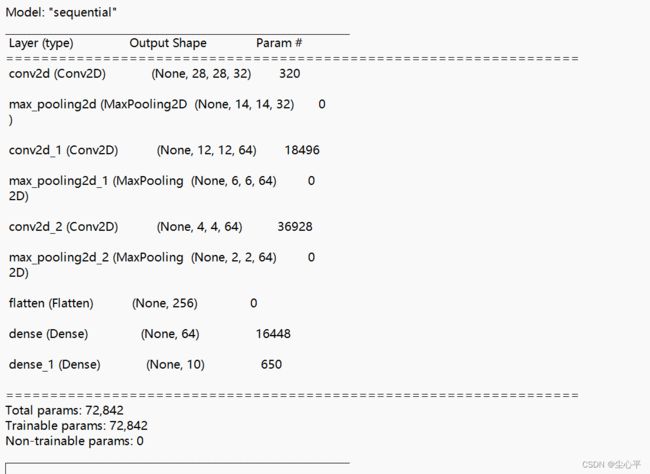
model.summary()
编译训练网络模型
# 编译
model.compile(optimizer='adam',  # 优化器
              loss=tf.keras.losses.SparseCategoricalCrossentropy(from_logits=True),
              # 设置损失函数from_logits: 为True时,会将y_pred转化为概率
              metrics=['accuracy'])

# 训练
# epochs为训练轮数
history = model.fit(train_images, train_labels, epochs=10,
                    validation_data=(test_images, test_labels))
评价网络模型
# 评价 plt.plot(history.history['accuracy'], label='accuracy') # 训练集准确度 plt.plot(history.history['val_accuracy'], label='val_accuracy ') # 验证集准确度 plt.plot(history.history['loss'], label='loss') # 训练集损失程度 plt.plot(history.history['val_loss'], label='val_loss') # 验证集损失程度 plt.xlabel('Epoch') # 训练轮数 plt.ylabel('value') # 值 plt.ylim([0, 1]) plt.legend(loc='lower left') # 图例位置 plt.show() test_loss, test_acc = model.evaluate(test_images, test_labels, verbose=1) # loss函数的值和 metrics值 # 输入数据和标签,输出损失值和选定的指标值(如精确度accuracy) print(test_loss, test_acc)观察得到,loss和val_loss均逐渐下降,是最好的情况
预测测试集
# 绘制测试集图片
class_names = ['T-shirt/top', 'Trouser', 'Pullover', 'Dress', 'Coat',
               'Sandal', 'Shirt', 'Sneaker', 'Bag', 'Ankle boot']
plt.figure(figsize=(20, 10))  # 这里只看20张,实际上并不需要可视化图片这一步骤
for i in range(20):
    plt.subplot(5, 10, i + 1)
    plt.xticks([])
    plt.yticks([])
    plt.grid(False)
    plt.imshow(test_images[i], cmap=plt.cm.binary)
    plt.xlabel(class_names[test_labels[i]])
plt.show()

# 预测
pre = model.predict(test_images)  # 对所有测试图片进行预测
for x in range(5):
    print(pre[x])
for x in range(5):
    print(class_names[np.array(pre[x]).argmax()])
