【论文翻译】聚类算法研究
论文题目:聚类算法研究
论文来源:聚类算法研究
翻译人:BDML@CQUT实验室
聚类算法研究
孙吉贵 , 刘 杰 , 赵连宇
Clustering Algorithms Research
SUN Ji-Gui, LIU Jie, ZHAO Lian-Yu
摘 要
对近年来聚类算法的研究现状与新进展进行归纳总结.一方面对近年来提出的较有代表性的聚类算法,从算法思想、关键技术和优缺点等方面进行分析概括;另一方面选择一些典型的聚类算法和一些知名的数据集,主要从正确率和运行效率两个方面进行模拟实验,并分别就同一种聚类算法、不同的数据集以及同一个数据集、不同的聚类算法的聚类情况进行对比分析.最后通过综合上述两方面信息给出聚类分析的研究热点、难点、不足和有待解决的一些问题.上述工作将为聚类分析和数据挖掘等研究提供有益的参考.
关键词: 聚类;算法;实验
Abstract
The research actuality and new progress in clustering algorithm in recent years are summarized in this paper. First, the analysis and induction of some representative clustering algorithms have been made from several aspects, such as the ideas of algorithm, key technology, advantage and disadvantage. On the other hand, several typical clustering algorithms and known data sets are selected, simulation experiments are implemented from both sides of accuracy and running efficiency, and clustering condition of one algorithm with different data sets is analyzed by comparing with the same clustering of the data set under different algorithms. Finally, the research hotspot, difficulty, shortage of the data clustering and some pending problems are addressed by the integration of the aforementioned two aspects information. The above work can give a valuable reference for data clustering and data mining.
Key words: clustering; algorithm; experiment
引言
聚类分析研究有很长的历史,几十年来,其重要性及与其他研究方向的交叉特性得到人们的肯定.聚类是数据挖掘、模式识别等研究方向的重要研究内容之一,在识别数据的内在结构方面具有极其重要的作用.聚类主要应用于模式识别中的语音识别、字符识别等,机器学习中的聚类算法应用于图像分割和机器视觉,图像处理中聚类用于数据压缩和信息检索.聚类的另一个主要应用是数据挖掘(多关系数据挖掘)、时空数据库应用(GIS等)、序列和异类数据分析等.此外,聚类还应用于统计科学.值得一提的是,聚类分析对生物学、心理学、考古学、 地质学、地理学以及市场营销等研究也都有重要作用[1−3].
本文一方面从算法思想、关键技术和优缺点等方面对近年提出的较有代表性的聚类算法进行了分析、介 绍;另一方面又选用多个知名数据集对一些典型算法进行了测试.而后综合这两方面信息得出一些相应的结论.
本文第 1 节简单介绍聚类概念、聚类过程与聚类算法的类别.第 2 节重点阐述 17 个较有代表性的算法.第 3 节描述 8 种聚类算法的模拟实验结果,并结合文献[4]进行分析.第 4 节给出本文的一些结论.
Introduction
The research of cluster analysis has a long history. For decades, its importance and cross characteristics with other research directions have been affirmed.Clustering is one of the important research contents of data mining and pattern recognition, which plays an extremely important role in identifying the internal structure of data.clustering is mainly applied to speech recognition, character recognition and so on in pattern recognition. Clustering algorithms in machine learning are applied to image segmentation and machine vision. clustering in image processing is used for data compression and information retrieval.Another major application of clustering is data mining (multi-relational data mining), spatiotemporal database applications (GIS, etc.), sequence and heterogeneous data analysis.In addition, clustering is applied to statistical science. It is worth mentioning that cluster analysis also plays an important role in biology, psychology, archaeology, geology, geography and marketing.
On the one hand, this paper analyzes and introduces the representative clustering algorithm proposed in recent years from the aspects of algorithm idea, key technology, advantages and disadvantages, and on the other hand, several well-known data sets are selected to test some typical algorithms. Then synthesizing these two aspects of information to draw some corresponding conclusions.
Section 1 of this paper briefly introduces the concept of clustering, clustering process and clustering algorithm categories. Section 2 focuses on 17 more representative algorithms. section 3 describes the simulated experimental results of 8 clustering algorithms and analyzes them in combination with literature [4]. Section 4 gives some conclusions of this paper.
1 聚类与聚类算法类别
1.1 聚类概念与聚类过程
迄今为止,聚类还没有一个学术界公认的定义.这里给出 Everitt[5]在 1974 年关于聚类所下的定义:一个类簇内的实体是相似的,不同类簇的实体是不相似的;一个类簇是测试空间中点的会聚,同一类簇的任意两个点间的距离小于不同类簇的任意两个点间的距离;类簇可以描述为一个包含密度相对较高的点集的多维空间中的连通区域,它们借助包含密度相对较低的点集的区域与其他区域(类簇)相分离.
事实上,聚类是一个无监督的分类,它没有任何先验知识可用.聚类的形式描述如下:
令U={p1 ,p2 ,…,pn }表示一个模式(实体)集合,pi 表示第 i 个模式 i={1,2,…,n};Ct⊆U,t=1,2,…,k,![]()
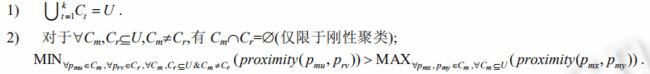
其中,第 1 个下标表示模式所属的类,第 2 个下标表示某类中某一模式,函数 proximity 用来刻画模式的相似性距离.若诸类 Ct 为聚类之结果,则诸 Ct 需满足如下条件:
典型的聚类过程主要包括数据(或称之为样本或模式)准备、特征选择和特征提取、接近度计算、聚类(或分组)、对聚类结果进行有效性评估等步骤。
聚类过程:
- 数据准备:包括特征标准化和降维.
- 特征选择:从最初的特征中选择最有效的特征,并将其存储于向量中.
- 特征提取:通过对所选择的特征进行转换形成新的突出特征.
- 聚类(或分组):首先选择合适特征类型的某种距离函数(或构造新的距离函数)进行接近程度的度量; 而后执行聚类或分组.
- 聚类结果评估:是指对聚类结果进行评估.评估主要有 3 种:外部有效性评估、内部有效性评估和相关性测试评估.
1.2 聚类算法的类别
没有任何一种聚类技术(聚类算法)可以普遍适用于揭示各种多维数据集所呈现出来的多种多样的结构[7].根据数据在聚类中的积聚规则以及应用这些规则的方法,有多种聚类算法.聚类算法有多种分类方法,本文将聚类算法大致分成层次化聚类算法、划分式聚类算法、基于密度和网格的聚类算法和其他聚类算法,如图 1 所示的 4 个类别.

图 1 聚类算法分类图
1 Clustering and clustering algorithm categories
1.1 Clustering Concept and Clustering Process
So far, there is no recognized definition of clustering in academia. Here Everitt[5] the definition of clustering in 1974: the entities in a cluster are similar and the entities of different clusters are not similar; a cluster is the convergence of the midpoint of the test space. The distance between any two points of the same cluster is smaller than that between any two points of different clusters.
In fact, clustering is an unsupervised classification that has no prior knowledge available. The form of clustering is described as follows:
Order U={ p1, p2,…,pn} represents a set of patterns, pi represents the i mode i={1, 2,…, n}; Ct⊆U, t=1, 2,…, k,![]()
Among them, The first subscript represents the class to which the pattern belongs, The second subscript represents a pattern in a class, Function proximity used to describe the similarity distance of patterns. If the Ct of each class is the result of clustering, Ct shall satisfy the following conditions: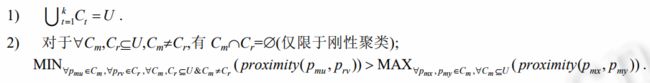
The typical clustering process mainly includes the steps of data (or sample or pattern) preparation, feature selection and feature extraction, proximity calculation, clustering (or grouping), and evaluation of the effectiveness of clustering results.
Clustering process :
1)data preparation: including feature standardization and dimensionality reduction. 2) feature selection: selecting the most effective feature from the original feature, and store it in a vector.
3)feature extraction: a new prominent feature is formed by transforming the selected feature.
4) clustering (or grouping): first select a distance function of the appropriate feature type (or construct a new distance function) to measure the degree of proximity; Then execute clustering or grouping. Evaluation of .
5) clustering results: refers to the evaluation of clustering results. There are three main types of evaluation: external effectiveness evaluation, internal effectiveness evaluation and correlation test evaluation.
1.2 Categories of clustering algorithms
No clustering technique (clustering algorithm) can be widely used to reveal the various structural [7] presented by various multidimensional datasets. According to the accumulation rules of data in clustering and the methods of applying these rules, there are many clustering algorithms. There are many kinds of classification methods in clustering algorithm. In this paper, the clustering algorithm is roughly divided into hierarchical clustering algorithm, divided clustering algorithm, density and grid based clustering algorithm and other clustering algorithms, as shown in figure 1.
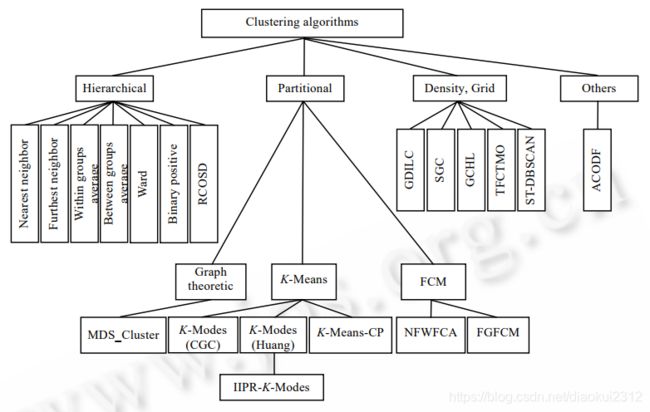
Fig.1 The classification chart of clustering algorithms
2 聚类算法
2 Clustering Algorithm
2.1 层次聚类算法
2.1 Hierarchical clustering algorithm
层次聚类算法又称为树聚类算法,它使用数据的联接规则,透过一种层次架构方式,反复将数据进行分裂或聚合,以形成一个层次序列的聚类问题解.本文仅以层次聚类算法中的层次聚合算法为例进行介绍.层次聚合算法的计算复杂性为 O(n2),适合于小型数据集的分类.
Hierarchical clustering algorithm, also known as tree clustering algorithm [8,9], uses the join rules of data to divide or aggregate the data repeatedly through a hierarchical architecture to form a hierarchical sequence of clustering problem solutions. This paper only introduces the hierarchical aggregation algorithm in hierarchical clustering algorithm. the computational complexity of hierarchical aggregation algorithm is O (n2), which is suitable for the classification of small data sets.
2.1.1 层次聚合算法
2.1.1 hierarchical aggregation algorithm
该算法由树状结构的底部开始逐层向上进行聚合,假定样本集 S={o1,o2,…,on}共有 n 个样本.
HA1[初始化]. 置每个样本 oi 为一个类; /共形成 n 个类:o1,o2,…,on/
HA2[找最近的两个类]. ![]()
/*从现有的所有类中找出距离最近(相似度最大)的两个类 or 和 ok/
HA3[合并 or 和 ok]. 将类 or 和 ok 合并成一个新类 ork; //现有的类数将减 1//
HA4. 若所有的样本都属于同一个类,则终止本算法;否则,返回步骤 HA2.
The algorithm starts from the bottom of the tree structure to aggregate up layer by layer, assuming that the sample set S={ o1,o2,…,on} has n samples.
HA1[ initialization]. Each sample is oi as a class; /* Forming n categories: o1, o2,…,on*/
HA2[ find the nearest two classes].![]() /* Identify two classes with the closest (maximum similarity) or and ok*/ from all existing classes
/* Identify two classes with the closest (maximum similarity) or and ok*/ from all existing classes
HA3[ merger or and ok]. Merge class or and ok into a new class ork;/* the number of existing classes will be reduced by 1*/
HA4. terminates this algorithm if all samples belong to the same class; otherwise, HA2. steps are returned
2.1.2 传统聚合规则
2.1.2 traditional aggregation rules
两个类之间距离的度量方法是传统层次聚合算法的重要组成部分,它主要包括两个重要参数相似性度量方法和联接规则.这里采用欧式距离作为相似性度量方法,联接规则主要包括单联接规则、完全联接规则、类间平均联接规则、类内平均联接规则和沃德法.这几种联接规则可定义如下[8](其中,含||x−y||是欧几里德范数, ni和 nk 分别指类 or 和 k o 中的样本个数,C(ni+nk,2)表示从 ni+nk 个元素中抽出两个元素的不同组合的方法总数):
单联接聚合规则: ![]()
全联接聚合规则:![]()
类间平均联接聚合规则:![]()
类内平均联接聚合规则:![]()
沃德法:![]() 其中,n 是融合聚类的中心.
其中,n 是融合聚类的中心.
The measurement of distance between two classes is an important part of traditional hierarchical aggregation algorithm, It mainly includes two important parameter similarity measurement methods and join rules. Using Euclidean distance as similarity measure, The join rules mainly include single join rule, complete join rule, inter-class average join rule, intra-class average join rule and Ward method. For example, these join rules can be defined as [8], Containing ||x−y|| is the Euclidean norm, ni and nk refer to the number of samples in class or and k o, respectively, C (ni nk), 2) represents the total number of methods for extracting different.
Single-link convergence compliance: ![]()
Universal Convergence Compliance: ![]()
Interclass average join aggregation rules:![]()
In-class average join aggregation rules:![]()
Wardfa:![]() Among them, n is the center of fusion clustering.
Among them, n is the center of fusion clustering.
2.1.3 新层次聚合算法
2.1.3 New Level Aggregation Algorithm
(1) Binary-Positive 方法
2007 年,Gelbard 等人[4]提出了一种新的层次聚合算法,被称为正二进制(binary-positive)方法.该方法把待分类数据以正的二进制形式存储于一个二维矩阵中,其中,行表示记录(对象),列表示其属性的可能取值.记录对应的取值为 1 或者 0,分别表示此记录有对应的属性值或者不存在对应属性值.因此,相似性距离计算只在被比较的二进制向量中的正比特位上进行,即只在取值为 1 的记录(对象)之间进行.有以 Dice 距离为代表的多种Binary-Positve 相似性测量方法[10,11].
Gelbard 等人采用 Wine,Iris,Ecolic 和 Psychology balance 这 4 种数据集对 11 种聚类算法进行了实验,结果表明,对于此 4 种数据集中的任意一种数据的聚类结果,Binary-Positive 等 4 种方法在聚类结果的准确率方面,从总体上来看都是最好的.同时他们还认为,将原始数据转换成正二进制会改善聚类结果的正确率和聚类的鲁棒性,对于层次聚类算法尤其如此.
(2) 连续数据的粗聚类算法(rough clustering of sequential data,简称 RCOSD)
2007 年,Kumar 等人[12]面向连续数据提出了一种新的基于不可分辨粗聚合的层次聚类算法 RCOSD.在该算法中,不可分辨关系被扩展成具有不严格传递特性的容差关系.使用相似性的上近似形成初始类,使用约束相似性的上近似概念形成后续类,其中的一个相对的相似性条件被用作合并准则.RCOSD 的关键思想是寻找能捕捉数据序列的连续信息及内容信息的一个特征集,并把这些特征集映射到一个上近似空间,应用约束相似性上近似技术获得粗类簇的上近似,其中一个元素可以属于多个类簇.该算法引入 S3M 作为 Web 数据的相似性度量方法,S3M 既考虑了项的出现次序又考虑了集合内容.该算法每一次迭代可以合并两个或多个类,所以加快了层次聚类速度.该算法能够有效挖掘连续数据,并刻画类簇的主要特性,帮助 Web 挖掘者描述潜在的新的 Web 用户组的特性.
Pradeep Kumar 等人在本质连续的 MSNBC Web 导航数据集上的实验结果表明,与使用序列向量编码的传统层次化聚类算法相比,RCOSD聚类算法是可行的.算法给出的描述方法能够帮助 Web挖掘者鉴别潜在的有意义的用户组.
(1) Binary-Positive methods
2007, Gelbard et al [4] proposed a new hierarchical aggregation algorithm, are called positive binary (binary-positive) methods. This method stores the data to be classified in positive binary form in a two-dimensional matrix, Among them, A line represents a record (object), A column represents the possible value of its attribute. Record a value of 1 or 0, Indicates that this record has a corresponding attribute value or that there is no corresponding attribute value. Therefore, the similarity distance calculation is performed only on the proportional special bits in the compared binary vector, That is, only between records (objects) with a value of 1. There are many Binary-Positve similarity measurement methods represented by Dice distance.
Gelbard et al. used the Wine,Iris,Ecolic and Psychology balance data sets to experiment with 11 clustering algorithms. the results show that for any of the four data sets, Binary-Positive and other four methods are the best in terms of the accuracy of clustering results. Overall, it is the best. At the same time, they also think that converting raw data into positive binary will improve the accuracy of clustering results and the robustness of clustering, especially for hierarchical clustering algorithms.
(2)Rough clustering of sequential data
Kumar et al. proposed a new hierarchical clustering algorithm based on non-resolved coarse aggregation [12] the continuous data in 2007 RCOSD. in which the non-resolved relation is extended to the tolerance relation with the impenetrable transfer property. the upper approximation of similarity is used to form the initial class, and the upper approximation concept of constraint similarity is used to form the subsequent class, in which a relative similarity condition is used as the merging criterion. RCOSD key idea is to find a feature set that can capture the continuous information and content information of the data sequence, and map these feature sets to an upper approximation space, and apply the constraint similarity approximation technique to obtain the upper approximation of the coarse cluster. One element can belong to multiple clusters. The algorithm introduces the similarity measure method of S3M as Web data, which considers both the order of items and the content of the set. Each iteration of the algorithm can merge two or more classes, so the hierarchical clustering speed is accelerated. The algorithm can effectively mine continuous data and depict the main characteristics of clusters, which helps Web miners to describe the characteristics of potential new Web user groups.
The experimental results of Pradeep Kumar et al on essentially continuous MSNBC Web navigation data sets show that RCOSD clustering algorithm is feasible compared with traditional hierarchical clustering algorithm using sequence vector coding. A description given by the algorithm can help Web diggers identify potentially meaningful user groups.
2.2 划分式聚类算法
2.2 Divisional clustering algorithm
划分式聚类算法需要预先指定聚类数目或聚类中心,通过反复迭代运算,逐步降低目标函数的误差值,当目标函数值收敛时,得到最终聚类结果.
The partition clustering algorithm needs to specify the number of clusters or the cluster center in advance. Through repeated iterative operations, the error value of the objective function is gradually reduced. When the value of the objective function converges, the final clustering result is obtained.
2.2.1 K 均值聚类
2.2.1 K mean clustering
1967年,MacQueen首次提出了 K均值聚类算法(K-means算法).迄今为止,很多聚类任务都选择该经典算法.该算法的核心思想是找出 K 个聚类中心 c1,c2,…,cK,使得每一个数据点 xi 和与其最近的聚类中心 cv 的平方距离和被最小化(该平方距离和被称为偏差 D).
K 均值(K-means)聚类算法[8](对 n 个样本进行聚类)
K1[初始化]. 随机指定 K 个聚类中心(c1,c2,…,cK);
K2[分配 xi]. 对每一个样本 xi,找到离它最近的聚类中心 cv,并将其分配到 cv 所标明类;
K3[修正 cw]. 将每一个 cw 移动到其标明的类的中心;
K4[计算偏差]. ![]()
K5[D 收敛?]. 如果 D 值收敛,则 return(c1,c2,…,cK)并终止本算法;否则,返回步骤 K2
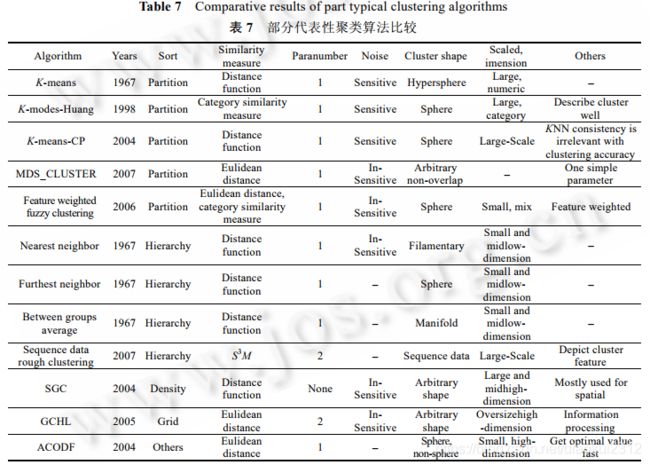
K-means 算法的优点与不足[13].优点:能对大型数据集进行高效分类,其计算复杂性为 O(tKmn),其中,t 为迭代次数,K 为聚类数,m 为特征属性数,n 为待分类的对象数,通常,K,m,t< 以经典 K-means 算法为基础,研究者们提出了很多新的改进的 K-means 算法,下面对其中的一些算法加以介绍. 1967, MacQueen first proposed K mean clustering algorithm (K-means algorithm). So far, Many clustering tasks choose this classical algorithm. The core idea of the algorithm is to find out the c1, of K cluster centers c2,…,cK, So that the sum of square distances cv each data point xi and its nearest cluster center is minimized (this sum of square distances is called bias D). The advantages and disadvantages of K-means algorithm are [13]. Advantages: efficient classification of large data sets, and its computational complexity is O (tKmn), Among them, t number of iterations, K cluster number, m is the characteristic attribute number, n is the number of objects to be classified, Usually, K,m, t< On the basis of classical K-means algorithms, researchers have proposed many new improved K-means algorithms, some of which are introduced below. (1) K-modes-Huang 算法[14] 1998 年,Huang 为克服 K-means 算法仅适合于数值属性数据聚类的局限性,提出了一种适合于分类属性数据聚类的 K-modes 算法.该算法对 K-means 进行了 3 点扩展:引入了处理分类对象的新的相异性度量方法(简单的相异性度量匹配模式),使用 modes 代替 means,并在聚类过程中使用基于频度的方法修正 modes,以使聚类代价函数值最小化. 这些扩展允许人们能够直接使用 K-means 范例聚类有分类属性的数据,无须对数据进行变换.K-modes 算法的另一个优点是 modes 能给出类的特性描述,这对聚类结果的解释是非常重要的.事实上,K-modes 算法比K-means 算法能够更快收敛.Huang 使用众所周知的大豆疾病数据集对其算法进行了测试,结果表明,K-modes算法具有很好的聚类性能.进一步地,他用包含 50 万条记录和 34 个分类属性的健康保险数据集进行了测试,结果证明,该算法在(聚类的)类数和记录数两个方面是真正可伸缩的. 与 K-means 算法一样,K-modes 算法也会产生局部最优解,依赖于初始化 modes 的选择和数据集中数据对象的次序.初始化 modes 的选择策略尚需进一步研究. 1999 年,Huang 等人[15]证明了经过有限次迭代 K-modes 算法仅能收敛于局部最小值. (2) K-modes-CGC 算法 在蒙特卡罗模拟中,Chaturvedi 等人用 K-modes-CGC 和潜类算法[17]来恢复一个已知的潜在类结构,结果表明,两者具有相等的执行效率.然而,K-modes-CGC 算法不但在速度方面比潜类算法快一个数量级,而且更少遇到局部最优的情况.对于包含大量分类变量的数据集,潜类算法计算极其缓慢,变得不可行. 尽管在一些情况下,潜类算法比 K-modes-CGC 算法执行得更好,但 Chaturvedi 猜测在另外一些情况下,潜类算法很可能是不可行的.因此,Chaturvedi 等人建议在执行聚类分析时应互补地使用这两种方法,同时给出了K-modes-CGC 算法和潜类算法的经验比较,结果表明前者更占优势. 2003 年,Huang[18]证明了 K-modes-CGC 算法与 K-modes-Huang 算法是等价的. (1) K-modes-Huang algorithm And in the K-means algorithm, mean cluster-like centers, or centroids, Refers to the mean of all objects in a cluster about attributes, initially can be randomly specified. And in the K-modes algorithm, modes can be defined as follows:X={X1,X2,…,Xn}is a data set.∀Xi∈X are classified by m attributes{A1,A2,…, Am} describe it,Xi can be expressed as vector 〈xi1,xi2,…,xim〉,It can also be expressed as a combination of attribute-value pairs[A1=xi1]∧…∧[Am=xim];Q is a X mode,Q that can be expressed as a vector〈q1,q2,…,qm〉,It can also be expressed as a combination of attribute-value pairs [A1=q1]∧…∧[Am=qm],Q need to make Huang proposed a K-modes algorithm for classifying attribute data clustering in 1998 to overcome the limitation that K-means algorithm is only suitable for numerical attribute data clustering. The algorithm extends the K-means by three points: a new heterogeneity measurement method (simple matching mode of heterogeneity measurement) is introduced to deal with classification objects, which is replaced by modes means, and modified by frequency-based method in clustering process to minimize the value of clustering cost function. These extensions allow people to cluster data with classified attributes directly using K-means paradigm without having to transform the data. another advantage of the K-modes algorithm is that modes can give a description of the features of the algorithm, which is very important for the interpretation of the clustering results. in fact, K-modes algorithm can converge faster than K-means algorithm. Huang used the well-known soybean disease data set to test its algorithm, the results show that the K-modes algorithm has good clustering performance. Further, he tested the health insurance data set with 500000 records and 34 classification attributes. The results show that the algorithm is truly scalable in terms of the number of classes and records. Like the K-means algorithm, the K-modes algorithm also produces a local optimal solution that relies on the selection of initialization modes and the order of data objects in the dataset. A selection strategy for initializing modes needs further study. Huang et al. proved that the algorithm can only converge to K-modes local minimum after finite iteration in 1999. (2) K-modes-CGC algorithms Chaturvedi et al. used K-modes-CGC and latent class algorithm [17] to recover a known latent class structure in monte carlo simulation. the results show that both have equal execution efficiency. However, the K-modes-CGC algorithm not only is an order of magnitude faster than the latent class algorithm in terms of speed, but also less meets the local optimal situation. For data sets containing a large number of classification variables, the latent class algorithm is extremely slow and becomes unfeasible. While in some cases the latent class algorithm performs better than the K-modes-CGC algorithm, Chaturvedi guess that in others the latent class algorithm is likely not feasible. therefore, Chaturvedi et al. suggested that the two methods should be used complementaryly when performing cluster analysis. at the same time, the empirical comparison between K-modes-CGC algorithm and latent class algorithm is given. the results show that the former is more dominant. Huang proved that K-modes-CGC algorithm is equivalent to K-modes-Huang algorithm in 2003. 2002 年,Sun 等人[19]将 Bradley 等人的迭代初始点集求精算法[20]应用于 K-modes 算法(Huang,1998).尽管Huang 的 K-modes 算法能够聚类分类数据,但它需要预先决定或随机选择类(簇)的初始 modes,并且初始 modes的差异常常会导致截然不同的聚类结果.文中,Sun 等人给出了一个关于应用 Bradley 等人的迭代初始点求精算法于 K-modes 聚类的实验研究. Sun 等人用知名大豆疾病[21]数据集进行测试,大豆疾病数据包含 47 个记录,每个记录由 35 个特征描述.每个记录都被标记为以下 4 种疾病中的一种:Diaporthe StemCanker,Charcoal Rot,Rihizoctonia Root Rot 以及Phytophthora Rot,除了 Phytophthora Rot 有 17 个记录外,其他 3 种疾病都有 10 个记录.针对 K-modes 算法,分两种方案对大豆疾病数据集进行聚类实验:方案 1 随机选择初始点集;方案 2 采用迭代初始点集求精方法选择初始点集.实验结果表明,采用方案 2 的 K-modes 算法能够产生更高精度和更可靠的聚类结果.求精算法在给定数据集的一个小子样本集上进行,因此只需存储全部数据的内存空间的一小部分.然而,对于更大、更复杂分布的数据集,关于算法的可伸缩性和适应性方面还有许多问题需要研究. 2002, Sun et al .[19] applied the actuarial method of iterative initial point set calculation [20] Bradley et al. to the K-modes algorithm (Huang,). 1998). Though Huang K-modes algorithm can cluster classified data, But it needs to predetermine or randomly select the initial modes, of classes And the difference of initial modes often leads to very different clustering results. In this article, Sun et al. presented an experimental study on K-modes clustering using the iterative initial point refinement algorithm of Bradley et al. Sun and others tested with well-known soybean disease [21] data sets, Soybean disease data contained 47 records, each record is described by 35 features. Each record was marked as one of the following four diseases: Diaporthe StemCanker, Charcoal Rot, Rihizoctonia Root Rot and Phytophthora Rot, Except Phytophthora Rot have 17 records, The other three diseases were recorded in 10. For K-modes algorithms, Clustering experiment of soybean disease data set was carried out in two schemes: scheme 1 randomly selected initial point set; Scheme 2 selects the initial point set by iterative initial point set refinement method. Experimental results show that, K-modes algorithm using scheme 2 can produce more accurate and reliable clustering results. The refinement algorithm is performed on a small sample set of a given data set, So just a fraction of the memory space that stores all the data. However, For larger, more complex data sets, There are still many problems to be studied about the scalability and adaptability of the algorithm. 2004 年,Ding 等人[22]提出一致性保留 K-means 算法(K-means-CP).最近邻一致性是统计模式识别中的一个重要概念,他们将这个概念扩展到数据聚类,对一个类中的任意数据点,要求它的 k 最近邻和 k 互最近邻都必须在该类中.他们研究了类的 k 最近邻一致性的性质,提出了 kNN 和 kMN 一致性强制和改进算法,并提出了将类 k最近邻或类 k 互最近邻一致性作为数据聚类的一种重要质量度量方法.他们选用互联网上 20 个新闻组数据集进行了实验,结果表明,k 最近邻一致性、k 互最近邻一致性以及算法聚类的正确率都得到显著改善.同时,这也表明局部一致性信息可帮助全局聚类目标函数优化. 算法 K-means-CP. Algorithm K-means-CP 1969 年,Ruspini 首次将模糊集理论应用到聚类分析中,提出了模糊聚类算法(fuzzy c-means,简称 FCM).FCM 算法是图像分割使用最多的方法之一,它的成功主要归功于为解决每个图像像素的隶属需要引入了模糊性.比之脆弱(crisp)或硬分割方法,FCM 能够保留初始图像的更多信息.然而,FCM 的一个缺点是不考虑图像上下文中的任何空间信息,这使得它对噪声和其他人造图像非常敏感.人们围绕 FCM 算法开展了大量研究,下面只对这方面的最新研究作简单介绍[23,24]. 2006 年,李洁等人[25]提出基于特征加权的模糊聚类新算法 NFWFCA.传统模糊 K-均值算法、K-modes 算法和 K-原型算法都假定样本矢量的各维特征对聚类贡献相同.但在实际应用中,由于样本矢量的各维特征来自不同传感器,存在测量精度及可靠性等差异,样本矢量的各维特征对聚类影响不尽相同.以模糊 K-原型算法为基础,算法 NFWFCA 采用 ReliefF 算法[26]确定各维特征的权重,数值特征权值的计算方法为 通过各种实际数据集的测试,实验结果表明,该算法的聚类结果较之传统模糊 K-均值算法、K-modes 算法和 K-原型算法要更准确、更高效.同时,该算法还可以分析各维特征对聚类的贡献度,有效进行特征提取和优选,这对聚类算法研究及其应用都有一定的意义. 2007 年,Cai 等人[27]结合局部空间和灰度信息,提出快速通用 FCM 聚类算法 FGFCM,其特点为:(1) 用一个新因子 Sij 作局部(空间和灰度)相似性度量,不仅确保图像的抗扰性、保留图像细节,而且除去了经验调节参数α;(2) 分割时间只与灰度级数 q 有关,与图像大小 N(>>q)无关,因此,其聚类时间复杂性由 O(NcI1)减少到 O(qcI2),其中,c 为聚类数目,I1 和 I2( Ruspini first applied fuzzy set theory to cluster analysis in 1969 and proposed fuzzy clustering algorithm (fuzzy c-means, short FCM). FCM algorithm is one of the most used methods for image segmentation, and its success is mainly attributed to the introduction of fuzziness to solve the membership of each image pixel. FCM can retain more information about the initial image than its fragile (crisp) or hard segmentation methods. however, a disadvantage of FCM is that it does not consider any spatial information in the image context, which makes it very sensitive to noise and other artificial images. A great deal of research has been done around FCM algorithms. Here is a brief introduction to the latest research. Li Jie et al .[25] proposed a new fuzzy clustering algorithm based on feature weighting NFWFCA. traditional fuzzy K- mean algorithm, K-modes algorithm and K- prototype algorithm all assume that each dimension feature of sample vector contributes the same to clustering. However, in practical application, because the characteristics of each dimension of sample vector come from different sensors, there are differences in measurement accuracy and reliability, and the characteristics of each dimension of sample vector have different effects on clustering. On the basis of fuzzy K- prototype algorithm, the algorithm NFWFCA uses ReliefF algorithm to determine the weight of each dimension feature. The calculation method of numerical feature weight is As J (W), P) hour, The clustering results are optimal. NFWFCA can also combine fuzzy K- mean, K-modes and K- prototypes. At λc =0, Corresponding weighted fuzzy K- mean algorithm; At λr =0, Corresponding weighted fuzzy K-modes algorithm; When λc = and λr λc =0, corresponding weighted fuzzy K prototype algorithm. The experimental results show that the clustering results are more accurate and efficient than the traditional fuzzy K- mean algorithm, K-modes algorithm and K- prototype algorithm. At the same time, the algorithm can also analyze the contribution of each dimension feature to clustering, and effectively extract and select features, which is of certain significance to the research and application of clustering algorithm. 2007, Cai and others combine local spatial and gray information, FGFCM, of Fast General FCM Clustering Algorithm Features :(1) Using a new factor Sij as a local (spatial and gray) similarity measure, Not only to ensure the immunity of the image, preserve the details of the image, And the α of the empirical parameters is removed;(2) The segmentation time is only related to the q of gray series, N with image size (>> q) nothing, Therefore, The clustering time complexity is reduced from O (NCI1) to O (QCI2), Among them, c number of clusters, I1 and I2( 1999 年,Jain[3]指出著名的图论分裂聚类算法的主要思想是:构造一棵关于数据的最小生成树(minimal spanning tree,简称 MST),通过删除最小生成树的最长边来形成类.基于图论的聚类算法主要包括:Random Walk,CHAMELEON, AUTOCLUST[28−30]等 2007 年,Li[31]提出一种基于最大θ距离子树的聚类算法 MDS_CLUSTER,使用阈值剪枝,剪掉最小生成树中所有长度大于阈值θ≥0 的边,从而生成最大θ距离子树集,其中每个最大θ距离子树的顶点集正好形成一个类.该算法的特点是:能发现任意形状非重叠的类,只要简单说明一个参数,该参数系指每个类中最少应包含的元素个数;还能提供一个分层体系结构中几个主要的类层次,这不同于由传统层次聚合方案所生成的包括所有层次的分层体系结构.此外,该算法能将小类中的元素作为数据集中的奇异值检测出来,如果奇异值数量相对大,则将这些奇异值合并成一个新类(称为背景类).模拟实验表明了该聚类方案的有效性. Jain pointed out in 1999 that the main idea of the famous graph theory split clustering algorithm is to construct a minimum spanning tree about data (minimal spanning tree, abbreviated as MST) to form a class by deleting the longest edge of the minimum spanning tree. Graph-based clustering algorithms include: Random Walk,CHAMELEON,AUTOCLUST, etc. Li proposed a clustering algorithm based on the maximum θ distance subtree in 2007 MDS_CLUSTER, using threshold pruning, all edges in the minimum spanning tree whose length is greater than the threshold θ≥0 are cut off to generate the maximum distance subtree set, where the vertex set of each maximum distance subtree forms exactly one class. The characteristic of this algorithm is that it can find any shape non-overlapping class, as long as a parameter is simply explained, this parameter refers to the minimum number of elements to be included in each class, and it can also provide several main class levels in a hierarchical architecture. This is different from the hierarchical architecture generated by the traditional hierarchical aggregation scheme. In addition, the algorithm can detect the elements in the subclass as singular values in the dataset. If the number of singular values is relatively large, the singular values can be merged into a new class (called background class). Simulation experiments show the effectiveness of the clustering scheme. 基于网格和密度的聚类方法是一类重要的聚类方法,它们在以空间信息处理为代表的众多领域有着广泛应用.特别是伴随着新近处理大规模数据集、可伸缩的聚类方法的开发,其在空间数据挖掘研究子域日趋活跃. 与传统聚类算法不同:基于密度的聚类算法,通过数据密度(单位区域内的实例数)来发现任意形状的类簇;基于网格的聚类算法,使用一个网格结构,围绕模式组织由矩形块划分的值空间,基于块的分布信息实现模式聚类.基于网格的聚类算法常常与其他方法相结合,特别是与基于密度的聚类方法相结合. 2001 年,Zhao 和 Song[32]给出网格密度等值线聚类算法 GDILC.密度等值线图能够很好地描述数据样本的分布.算法 GDILC 的核心思想——用密度等值线图描述数据样本分布.使用基于网格方法计算每一个数据样本的密度,发现相对的密集区域——类(或称为类簇).GDILC 具有消除奇异值和发现各种形状的类的能力,它是一种非监督聚类算法.他们的实验表明,GDILC 算法具有聚类准确率高和聚类速度快等特点. 2004 年,Ma[33]提出一种新的基于移位网格概念的基于密度和网格的聚类算法 SGC.SGC 是一种非参数类型的算法,它不需要用户输入参数,它把数据空间的每一维分成某些间隔以形成一个数据空间的网格结构.基于滑动窗口概念,为获得一个被更多描述的密度剖面引入了整个网格结构的移位概念,因此能够提高聚类结果的精度(准确度).与许多传统算法相比,该算法是高效的,因为类数据是基于网格单元的.该算法的主要优点可概括为:计算时间与数据集样本数无关;在处理任意形状类簇时展现了极好的性能;不需要用户输入参数;当处理大型数据集时,很少遇到内存受限问题. 2005 年,Pileva 等人[34]提出一种用于大型、高维空间数据库的网格聚类算法 GCHL.GCHL 将一种新的基于密度——网格的聚类算法和并行轴划分策略相结合,以确定输入数据空间的高密度区域——类簇.该算法能够很好地工作在任意数据集的特征空间中.GCHL 的主要特点为:(1) 只对数据扫描一次;将大型数据集划分成子部分,使用有限内存缓冲区一部分接一部分地进行处理;(2) 将类簇看成是由数据空间中的低密度区域划分的对象密集区域,能发现任意形状的类簇;(3) 能发现奇异值,对噪声数据不敏感;(4) 将数据空间量化为用于形成网格数据结构的有限数量的单元,所有的聚类操作都在网格结构上进行;聚类快速,聚类时间独立于数据对象数目和数据次序;(5) 适合大型、高维数据集的聚类. Pileva 等人的实验结果表明,该算法所获得的聚类结果是高质量的,具有发现凹/更深、凸/更高区域的能力,对奇异值和噪声的稳健性以及极好的伸缩性,这使其能够很好地应用于医疗和地理领域. 2006 年,Micro 等人[35]面向移动对象轨迹数据处理领域,基于简单的轨迹间距离概念,提出了一种基于密度的自适应聚类方法 TFCTMO,进一步考虑时态内在语义,给出时间聚焦方法以提高轨迹聚类效果.Mirco 等人将对象间的空间距离概念扩展到轨迹间的时空距离概念,由此将基于密度的聚类方法应用到轨迹上.Mirco 等人的关键思想是,将时态信息和空间信息相结合,使时态信息在移动对象轨迹聚类中起到了重要作用:根据所选取的时间区间的大小,轨迹间的相关程度是不同的.时间聚焦(temporal focusing)方法能够发现最有意义的时间区间,提高了移动对象轨迹聚类的质量. 2007 年,Derya 等人[36]对 DBSCAN(density-based spatial clustering of applications with noise)进行了与辨识核对象、噪音对象和邻近类簇相关的 3 个边缘扩展 , 进而提出一种新的基于密度的聚类算法ST-DBSCAN(spatial-temporal DBSCAN).与现有的基于密度聚类算法相比,该算法具有依据非空间值、空间值和时态值发现类簇的能力. Clustering methods based on grid and density are a kind of important clustering methods, which are widely used in many fields represented by spatial information processing. Especially with the recent development of large-scale data sets and scalable clustering methods, it is becoming more and more active in spatial data mining. Different from the traditional clustering algorithm: density-based clustering algorithm, through the data density (the number of instances in the unit region) to find any shape of clusters; grid-based clustering algorithm, using a grid structure, The value space divided by rectangular block is organized around the pattern, and the pattern clustering is realized based on block distribution information. Grid-based clustering algorithms are often combined with other methods, especially density-based clustering methods. The density isoline clustering algorithm is presented in Zhao and Song in 2001 GDILC. which can well describe the distribution of data samples. The core idea GDILC the algorithm —— to describe the data sample distribution by density isoline diagram. density of each data sample is calculated using a grid-based method, and relatively dense regions —— classes are found (or clusters of classes). GDILC has the ability to eliminate singular values and discover classes of various shapes. It is an unsupervised clustering algorithm. their experiments show that the GDILC algorithm has the characteristics of high clustering accuracy and fast clustering speed. Ma proposed a new density- and mesh-based clustering algorithm based on the concept of shift grid in 2004 SGC.SGC which is a non-parametric type algorithm that does not require user input parameters. It divides each dimension of the data space into certain intervals to form a grid structure of the data space. Based on the sliding window concept, the whole grid structure shift concept is introduced to obtain a density profile described more, so the accuracy of clustering results can be improved (accuracy). Compared with many traditional algorithms, the algorithm is efficient because the class data is based on grid cells. The main advantages of the algorithm can be summarized as follows: the calculation time is independent of the number of data set samples; it shows excellent performance in dealing with arbitrary shape clusters; it does not require user input parameters; when processing large data sets, Memory constraints are rarely encountered. 2005, Pileva et al. proposed a grid clustering algorithm for large, high-dimensional spatial databases GCHL.GCHL combining a new density-based —— grid clustering algorithm with a parallel axis partitioning strategy, to determine the high density region —— cluster of the input data space. The algorithm can work well in the feature space of any data set. GCHL main features are as follows :(1) Scan data only once; Divide large data sets into subsections, Use limited memory buffers to partially process; (2) Treating clusters as object-intensive regions divided by low-density regions in the data space, Clusters of arbitrary shapes can be found; (3) The singular value can be found, insensitive to noise data; (4) Quantifying the data space into a limited number of cells used to form a grid data structure, All clustering operations are carried out on the grid structure; Fast clustering, Clustering time is independent of data object number and data order; (5) Clustering for large, high-dimensional data sets. Experimental results from Pileva et al. show that the clustering results obtained by the proposed algorithm are of high quality, with the ability to discover concave/deep, convex/high regions, robustness to singular values and noise, and excellent scalability, which their good application in medical and geographic fields. Micro and others proposed a density-based adaptive clustering method based on the simple concept of inter-trajectory distance in the field of moving object trajectory data processing in 2006 TFCTMO, further considering the temporal intrinsic semantics, and giving a time-focusing method to improve the trajectory clustering effect. Mirco et al. extended the concept of spatial distance between objects to the concept of space-time distance between trajectories, thus applying density-based clustering method to trajectories. Mirco and other people’s key idea is that combining temporal information with spatial information makes temporal information play an important role in moving object trajectory clustering: according to the size of the selected time interval, the correlation degree between trajectories is different. time focusing (temporal focusing) method can find the most meaningful time interval and improve the quality of trajectory clustering of moving objects. Derya et al. carried out three edge extensions of DBSCAN (density-based spatial clustering of applications with noise) related to the identification of kernel objects, noise objects and adjacent clusters in 2007, and then proposed a new density-based clustering algorithm ST-DBSCAN (spatial-temporal DBSCAN). Compared with the existing density-based clustering algorithm, the algorithm has the ability to find clusters based on non-spatial, spatial and temporal values. 2004 年,Tsai 等人[37]提出一个新颖的具有不同偏好的蚁群系统(novel AS)——ACODF(a novel data clustering approach for data mining in large databases),用来解决数据聚类问题(当时未见用于数据聚类的ACO(ant colony optimization)算法的报道).设计一种不需要求解任何硬子问题(any hard sub-problem),但能给出近似最优解的聚类算法,是人们所期待的.ACODF 能够快速获得最优解,它所包含的 3 个重要策略介绍如下: (2) 为减少获得局部最优解所需要访问的城市数量,对蚁群采用模拟退火策略.为此设计了两个公式:ns(t+1)=ns(t)×T,其中,ns 是蚁群在 T0 函数期间访问的节点数,ns(t+1)表示当前蚁群的访问的节点数,ns(t)表示上一次循环蚁群访问的节点数,T 是一个常数(T=0.95). (3) 使用锦标赛(tournament)选择策略.与传统 ACO 不同,ACODF 采用锦标赛选择技术进行路径选择.即从N 条路径中随机选择 K 条路径,再从这 K 条路径中选择最短路径(N>K). Tsai 等人分别进行了模拟和实际数据实验.模拟数据实验:首先选含 579 个数据的数据集,分别用ACODF,GKA 和 FSOM+K-means 等 3 种算法进行非球形聚类;然后选含 300 个数据的数据集,依次用上面 3 种算法进行球形聚类.实际数据实验:采用 732 个客户信用卡上的 8 维实际数据,根据客户收入和消费进行聚类.实验结果表明,大多数情况下,ACODF 的搜索速度比 GKA 和 FSOM+K-means 更快,且错误率比它们更小. 2004, Tsai et al. propose a novel ant colony system (novel AS) with different preferences (an novel data clustering approach for data mining in large databases), For solving data clustering problems (there was no report on the ACO (ant colony optimization) algorithm for data clustering). Designing a hard subproblem (any hard sub-problem) that does not need to be solved, But the clustering algorithm with approximate optimal solution, Is what people expect. ACODF can get the optimal solution quickly, It contains three important strategies: (1) Apply (favorable) ACO strategies with different preferences. Each ant only needs to visit 1/10 of the total number of cities, and the number of cities visited decreases step by step. After several cycles, the pheromone concentration of the relatively short path between two points increases, and the pheromone of the relatively long path between two points decreases. Therefore, ants like to access close nodes and strengthen this path with their own pheromones (composed of nodes they like to access); finally, they form a path with high concentration, that is, clustering is completed. (2) In order to reduce the number of cities that need to be visited to obtain the local optimal solution, the simulated annealing strategy is ant colonies. Two formulas were designed for this purpose: ns(t+1)=ns(t)×T,where ns is the number of nodes visited by ant colonies during the T0 function, ns (t1) represents the number of nodes accessed by the current ant colony, and (t) represents the number of nodes accessed by the last cyclic ant colony, T is a constant (T=0.95).nf(t+1)=2×ns(t)/3−i×ns(t)/(run×3),The nf is the number of nodes visited by ant colony during T1 function, nf (t1) represents the number of nodes currently accessed by ant colony, nf (t) represents the number of nodes accessed by last cyclic ant colony, run=2, i∈{1/2}. (3) Use tournament (tournament) selection strategies. Unlike traditional ACO, ACODF use tournament selection techniques for path selection. That is, select K path randomly from N path, and then select the shortest path from this K path (N>K). Tsai et al. conducted simulation and actual data experiments respectively. Simulation data experiment: first select data set containing 579 data, ACODF, separately GKA and FSOM K-means algorithms for non-spherical clustering; Then select a data set of 300 data, The above three algorithms are used for spherical clustering in turn. Actual data experiment: using 8D actual data on 732 customer credit cards, Clustering according to customer income and consumption. Experimental results show that, Most of the time, ACODF search faster than GKA and FSOM K-means, And the error rate is smaller than them. 为了对有一定代表性的聚类算法给出进一步的分析,我们从重点介绍的 19 种算法中选出 8 种算法,从 UCI机器学习数据集储存库中选择了人们常用的 5 个数据集,分别针对分类属性数据和数值型数据对这 8 种算法进行了对比实验.实验的计算机环境为:处理器为 Pentium M 1.4GHz,内存 512MB,硬盘 80G,操作系统为 WindowsXP,编程语言为 VC 6.0. In order to further analyze the representative clustering algorithm, We select 8 of the 19 algorithms we focus on, From the UCI machine learning dataset repository, The eight algorithms are compared with the classification attribute data and the numerical data respectively. Experimental computer environment: processor is Pentium M 1.4GHz, 512 MB, memory G, hard drive Windows XP, operating system VC 6.0. programming language. 本文采用 Iris,Wine,Soybean,Zoo 和 Image 数据集作为测试数据集,前 4 个数据集为常用的知名数据集,已知其聚类结果可靠、并取得一致意见,适合做聚类分析的基准数据集.本文选用 Image 数据集的主要目的是与 Iris和 Wine 这两个基准数据集进行比较. 针对数值型数据,分别采用 Iris,Wine 和 Image 等 3 个数据集进行测试. Iris 包含 3 个类,每类各有 50 个元素,每一类代表一种类型的鸢尾花,150 个样本在 3 个类簇中分布均匀;其中,一类与另外两类线性可分,另外两类有部分重叠.Wine 数据集具有好的聚类结构,它包含 178 个样本,13 个数值型属性,分成 3 个类,每类中样本数量不同.Image 取自 UCI 机器学习数据集,本文作者在众多文献中未见其被使用.该数据集是从包含 7 个户外图像集合的数据库中随机选取的,并采用手工进行分类. 针对分类属性数据,分别采用 Soybean 和 Zoo 数据集进行测试. Soybean 数据集共有 47 个样本,具有 35 个属性,分为 4 类,是线性可分的,其所有属性都可作为分类属性.Zoo数据集共有 101 个记录,分为 7 类,是线性不可分的.在 Zoo 中,由 16 个属性来描述样本,其中 15 个为布尔属性值{0.1}和 1 个分类属性值属性(腿的数量){0,2,4,5,6,8}. This paper uses Iris,Wine,Soybean,Zoo and Image data sets as test data sets, and the first four data sets are commonly used well-known data sets. It is known that the clustering results are reliable and consistent, which is suitable for the benchmark data set of cluster analysis. The main purpose of this paper is to compare Image data sets with Iris and Wine data sets. Three data sets, such as Iris,Wine and Image, are used to test the numerical data. Iris contains three classes, Each has 50 elements, Each class represents a type of iris, 150 samples are uniformly distributed in 3 clusters; Among them, One class is linearly separable from the other two, The other two types overlap partially. Wine data sets have good clustering structure, It contains 178 samples, 13 numeric attributes, Divided into three classes, The number of samples in each class is different. Image taken from UCI machine learning datasets, The author has not seen it used in many literatures. The dataset was randomly selected from a database containing seven outdoor image sets, And use manual classification. Soybean and Zoo data sets are used to test the classified attribute data. Soybean a total of 47 samples, With 35 properties, In four categories, Is linearly separable, All its attributes can be used as classification attributes. Zoo data set has 101 records, Divided into seven categories, Is linear inseparable. And in the Zoo, From 16 attributes, of which 15 are boolean attribute values {0.1} and 1 categorical attribute value attributes (number of legs){0, 2,4, 5,6, 8}. 针对分类属性数据聚类,我们对 K-modes 算法、迭代初始点集求精 K-modes 算法分别采用线性可分大豆疾病数据和线性不可分动物园数据进行 20 次随机实验. To classify attribute data clustering, we performed 20 random experiments on K-modes algorithm and iterative initial point set refinement K-modes algorithm using linear separable soybean disease data and linear inseparable zoo data, respectively. 大豆疾病数据实验结果:我们采用 Sun 等人[19]提出的计算正确率的方法.正确率计算公式为 Experimental results of soybean disease data: we use the method of calculating the correct rate proposed by Sun et al. Correct rate formula: 下面对 K-modes 算法和迭代初始点集求精 K-modes 算法,用动物园数据[21]进行 20 次随机实验,实验结果见表 3.聚类正确率计算公式为 r=1−(错分样本个数/样本总数),且以下实验均采用该正确率计算公式. The following K-modes algorithm and iterative initial point set refinement K-modes algorithm, using zoo data for 20 random experiments, the experimental results are shown in Table 3. The formula of clustering accuracy is r=1−(number of misclassified samples / total number of samples), and the following experiments use this formula. 针对数值型数据,我们分别采用层次聚合算法中的单一联接法、完全联接法、类间平均联接法、沃德法和划分式聚类算法中的 K-means 算法,用 UCI 中的数据集 Iris,Wine,Image[29]随机进行了 20 次聚类实验,对比结果见表 4. We use the single join method, the complete join method, the average join method, the Ward method and the K-means algorithm of the partition clustering algorithm in the hierarchical aggregation algorithm. We use the data set Iris,Wine,Image[29] in the UCI to carry out 20 clustering experiments randomly. The comparison results are shown in Table 4. 选择 Iris 和 Wine 数值属性数据集,针对 K-means-CP 算法(采用欧式距离进行相似性计算),K 取 1~4,分别进行 20 次随机实验.实验结果(见表 5)表明,无论对数据集 Iris 还是数据集 Wine,都是在 K=3 时达到最高正确率.对于数据集 Iris,K=3 时正确率为 84.65%;对于数据集 Wine,K=3 时正确率为 64.00%.这说明 K-means-CP 算法对数据集的初始分类数具有一定的预测功能.此外,聚类结果在很大程度上依赖于所用相似性度量方式. 为判断 k 最近邻一致强制和保留算法是否明显优于 K 均值(K-means)算法、kNN 一致性与聚类质量之间有何关系,本文针对 K-means 算法、1 最近邻一致强制和保留算法(k=1,简记为 cp1 算法)和 2 最近邻一致强制和保留算法(k=2,简记为 cp2 算法),关于 Imagine,Iris,Wine,Glass,Ionosphere 等数值型数据集进行了 20 次随机聚类实验.从聚类结果的正确率和总体质量(简称质量)两个方面来评价聚类结果之优劣.总体质量(质量)可用类间差异与类内差异之比来度量.一类簇的紧凑程度可用该类簇中每个数据到该类簇质心之间距离的平方和来刻画.整个聚类的类簇内差、整个聚类之类簇间的差异以及总体质量则分别由下面的式(1)~式(3)来计算: 尽管聚类分析有着几十年的研究历史,众多聚类算法相继被提出、相关的应用被展开,但聚类问题仍然存在着巨大的挑战. 通过对一些比较有代表性的聚类算法的总结,可以得出如下一些结论: 大多数聚类算法都需要预先给出参数,事实上,如果没有相关知识和经验,这在多数情况下是不可行的.对于层次化聚类算法,如何找到聚合或分裂过程的有效终止条件仍然是一个开问题.由此,开展非参数聚类算法、将聚类算法与参数自动生成算法相结合、展示聚类过程等研究可能富有前景.Binary-Positive 方法(2007 年)的研究表明,将数据转换成正二进制会改善聚类结果的正确率和鲁棒性.粗聚类算法 RCOSD(2007)能够有效挖掘连续数据,并能描述类簇的主要特性,有助于理解聚类结果. 快速找到类的合理个数和较好的初始类中心点集,使算法终止于全局最优解等是划分式聚类算法的研究热点;对于 K-means 和 Fuzzy C-means 算法,还有使其适合分类属性数据集等研究课题.K-modes-Huang 算法适合分类属性数据,能给出类的特性描述,其对聚类数目和数据集规模都是可伸缩的,但已证明该算法经有限次迭代只能收敛于局部最优.2002 年的迭代初始点集求精 K-modes 算法较好地解决了 K-modes-Huang 算法常因初始modes 选择差异导致聚类结果截然不同的情况.2004 年,一致性保留算法 K-means-CP 的作者提出将 K 最近邻一致性作为聚类质量的度量方法,并给出局部一致性信息能支持全局聚类目标函数优化和聚类正确率有明显改善等结果,但我们的实验结果未能支持该论文的观点和结论.2006 年,基于特征加权模糊聚类算法通过分析各维特征对聚类的贡献度,有效进行特征提取和优选,在聚类效率和准确率方面较传统模糊聚类算法都有明显提高.2007 年,快速通用模糊聚类算法,一个通用框架,很多图像分割聚类算法都是其特例,它适合有噪声、无噪声多种类型图像和大幅灰度图像. 基于密度和网格聚类算法多用于时空信息处理、消除奇异值、发现各种形状的类簇,对噪声不敏感,适合大型、高维数据集等方面具有好的特性.网格密度等值线聚类算法 GDILC(2001)用密度等值线图描述样本分布,具有消除奇异值和发现各种形状类簇的能力.基于密度和网格的聚类算法 SGC(2004)是一种非参数类型的算法;计算时间与数据集规模无关;适于任意形状类簇.网格聚类算法 GCHL(2005)能够发现任意形状类簇和奇异值,对噪声数据不敏感;聚类快速,聚类时间独立于数据规模和数据次序,伸缩性极好;适合大型、高维数据集.基于密度自适应聚类方法 TFCTMO(2006)结合时态信息和空间信息,时间聚焦能够提高移动对象轨迹聚类质量.基于密度聚类算法 ST-DBSCAN(2007)能够综合使用非空间值、空间值和时态值实现聚类. 在很多文献中,研究者们给出了各自的聚类算法评价指标,并只给出其算法的优点.我们认为,开展聚类算法(全面、客观的)评价标准、数据集特性的描述方法等研究,不仅时机成熟,而且有着重要意义. 下面我们将给出关于文献[4]就 11 种算法和我们就 8 种算法所作的实验的分析,以作为对上述总结的补充.同时给出部分代表性算法的比较(见表 7). 本文对 8 种算法从 UCI 中选择 4 个知名聚类分析基准数据集和 1 个不常用数据集分别进行 20 次随机实验,并采用聚类正确率和运行时间作为衡量指标分别对数值型和类属性数据集进行实验;对 K-means-CP 算法,选数值型数据集,K 取不同值进行实验;对 K-means-CP 算法,选择相同数据集,用不同相似性度量方式进行测试.实验结果:对不同数据集、同一算法,其聚类正确率不相同;对同一数据集、不同聚类算法,其聚类正确率和效率会有很大差异;将 K-means 算法与 K-means-CP 算法使用不同数值型数据集进行了比较实验,结果表明,K-means-CP 算法丝毫也不优于 K-means 算法,k 最近邻一致性与聚类正确率无关,用 k 最近邻一致性刻画聚类质量是不合适的;对同一算法和同一数据集,不同的相似性度量方式,其聚类结果也不相同. 综合文献[4]和本文的实验得出的主要结论是:聚类算法的聚类结果有一定的不可预见性,在实际应用中应根据数据类型选择合适的聚类算法(和可恰当的相似性度量方式),以取得最佳的聚类效果.针对不同数据集,进一步开展聚类算法预测分类数的能力研究. Although clustering analysis has a history of decades, many clustering algorithms have been proposed one after another, and related applications have been expanded, but there are still great challenges in clustering problem. By summarizing some representative clustering algorithms, we can draw the following conclusions: Most clustering algorithms need to give parameters in advance, in fact, without relevant knowledge and experience, this is not feasible in most cases. For hierarchical clustering algorithm, how to find the effective termination condition of aggregation or splitting process is still an open problem. Therefore, the research of non-parametric clustering algorithm, combining clustering algorithm with automatic parameter generation algorithm and displaying clustering process may be promising. a study of Binary-Positive methods (2007) shows that converting data into positive binaries improves the accuracy and robustness of clustering results. Coarse clustering algorithm can RCOSD(2007) effectively mine continuous data and describe the main characteristics of clusters, which is helpful to understand clustering results. Quickly find a reasonable number of classes and a better set of initial class centers, So that the algorithm to terminate the global optimal solution is the focus of partition clustering algorithm; With K-means and Fuzzy C-means algorithms, And make it suitable for classification attribute data set and other research topics. K-modes-Huang algorithm is suitable for classifying attribute data, Can give you a description of the properties, which is scalable for both cluster number and dataset size, However, it has been proved that the algorithm can only converge to local optimum by finite iteration. The iterative initial point set refinement K-modes algorithm in 2002 solves the problem that K-modes-Huang algorithm often leads to different clustering results due to the difference of initial modes selection. 2004, The authors of the consistency retention algorithm K-means-CP proposed K nearest neighbor consistency as a measure of clustering quality, The results show that the local consistency information can support the optimization of global clustering objective function and the improvement of clustering accuracy, But our experimental results fail to support the views and conclusions of the paper. 2006, Based on the feature weighted fuzzy clustering algorithm, Effective feature extraction and selection, The clustering efficiency and accuracy are obviously improved compared with the traditional fuzzy clustering algorithm. 2007, Fast general fuzzy clustering algorithm, A general framework, Many image segmentation clustering algorithms are special cases, It is suitable for noisy, noise-free multi-type images and large gray-scale images. Density and grid clustering algorithms are used to process spatiotemporal information, eliminate singular values and discover clusters of various shapes, Unsensitive to noise, Suitable for large, high-dimensional data sets and other aspects with good characteristics. Grid density isoline clustering algorithm GDILC(2001) use density isoline diagram to describe sample distribution, It has the ability to eliminate singular values and discover clusters of various shapes. Clustering algorithm based on density and grid is SGC(2004) a non-parametric algorithm; The computation time is independent of the data set size; Suitable for arbitrary shape clusters. Grid clustering algorithm can GCHL(2005) find any shape clusters and singular values, insensitive to noise data; Fast clustering, Clustering time is independent of data size and data order, Excellent scalability; suitable for large, high-dimensional data sets. Based on density adaptive clustering TFCTMO(2006) combining temporal and spatial information, Time focusing can improve the quality of trajectory clustering of moving objects. Based on density clustering algorithm ST-DBSCAN(2007) we can use non-spatial value, spatial value and time-state value to realize clustering. In many literatures, researchers have given their own evaluation indexes of clustering algorithm, and only give the advantages of their algorithm. We believe that the study of clustering algorithm (comprehensive and objective) evaluation criteria, data set characteristics description methods and so on is not only ripe, but also of great significance. Below we will give an analysis of the literature [4] on 11 algorithms and our experiments on 8 algorithms as a supplement to the above summary. At the same time, a comparison of some representative algorithms is given (see Table 7). By selecting 4 well-known cluster analysis benchmark data sets and 1 less commonly used data set from the UCI, The clustering accuracy rate and running time are used as measures to test the numerical and class attribute data sets respectively; For K-means-CP algorithms, Select numeric data sets, Experiment K taking different values; For K-means-CP algorithms, Select the same data set, Test with different similarity measures. Experimental results: for different data sets, the same algorithm, The clustering accuracy is different; For the same data set, different clustering algorithms, Its clustering accuracy and efficiency will be very different; K-means algorithm and K-means-CP algorithm are compared with different numerical data sets, It turns out, K-means-CP algorithm is no better than K-means algorithm, k nearest neighbor consistency is independent of clustering accuracy, Characterization of clustering quality by k nearest neighbor consistency is inappropriate; For the same algorithm and the same data set, Different similarity measures, The clustering results are also different. According to the [4] of literature and the experiment in this paper, the main conclusion is that the clustering results of clustering algorithm are unpredictable. In practical application, the appropriate clustering algorithm (and appropriate similarity measurement) should be selected according to the data type to obtain the best clustering effect. For different data sets, the ability of clustering algorithm to predict classification numbers is further studied. 感谢刘大有教授对本文提纲和一些重点内容所给予的有益建议,感谢金弟同学对 K-means-CP 算法所做的编程和实验. Thank you Professor Liu Da for his useful suggestions on the outline and some key contents of this paper, and for the programming and experiment of K-means-CP algorithm.
K mean (K-means) clustering algorithm [8](clustering of n samples)
K1[ initialization]. Random designation of K cluster centers (c1,c2,…,cK);
K2[ distribution To each sample xi, find the nearest cluster center cv, and assign it to the class indicated by the cv;
K3[ Amendment cw]. (a) Move each cw to the centre of the class it identifies;
K4[ calculation deviation].![]()
K5[D convergence? ]. return (c1, c2,…, cK) if the D value converges; otherwise, K2 steps are returned.2.2.2 K-modes 算法
2.2.2 K-modes algorithm
在阐述 K-modes 算法之前,先对 Means 与 Modes 做简单介绍.
K-means 算法中,mean 为类簇中心或称为质心,是指一个类簇中所有对象关于属性的均值,最初可随机指定.在 K-modes 算法中,modes 可定义如下:设 X={X1,X2,…,Xn}是一个数据集,∀Xi∈X 由 m 个分类属性{A1,A2,…,Am}来描述,Xi 可表示成向量〈xi1,xi2,…,xim〉,又可表示成属性-值对的合取式式[A1=xi1]∧…∧[Am=xim];Q 是 X 的一个mode,Q 可表示成向量〈q1,q2,…,qm〉,也可表示成属性-值对的合取式[A1=q1]∧…∧[Am=qm],Q 需使![]() 取最小值,d1(Xi,Q)表示 Xi 与 Q 之间的距离, Q 不必是 X 的一个元素.
取最小值,d1(Xi,Q)表示 Xi 与 Q 之间的距离, Q 不必是 X 的一个元素.
2001 年,Chaturvedi 等人提出一种面向分类属性数据(名义尺度数据)的非参数聚类方法,称为 K-modesCGC算法,类似于面向数值数据(间隔尺度数据)的传统 K-means 算法.与现存的大多数面向分类属性数据的聚类方法不同,K-modes-CGC 算法显式地优化一个基于 L0 范数的损失函数.
The Means and Modes are briefly introduced before the K-modes algorithm is expounded.![]() take the minimum.d1(Xi, Q) indicates the distance between the Xi and the Q, which does not have to be an element of the X.
take the minimum.d1(Xi, Q) indicates the distance between the Xi and the Q, which does not have to be an element of the X.
Chaturvedi et al. proposed a nonparametric clustering method for classification attribute data (nominal scale data), called K-modesCGC algorithm, similar to traditional K-means algorithm for numerical data (interval scale data) in 2001. Unlike most existing clustering methods for classification attribute data, K-modes-CGC algorithm explicitly optimizes a loss function based on L0 norm.2.2.3 迭代初始点集求精 K-modes 算法
2.2.3 Algorithm for Finishing K-modes Initial Set of Iterative
2.2.4 一致性保留 K-means 算法(K-means-CP)
2.2.4 consistency retention K-means algorithm (K-means-CP)
1[初始化]. 随机选择 K 个点作为初始类的中心(c1,c2,…,cK);
2[分配近邻集]. 分配一个近邻集 S; //*将 S 分配到离其最近的类 Cp 中,![]()
3[更新类中心]. 置 ![]() //*更新聚类中心(即质心),mv 是类 Cv 的中心,nk=|Ck|
//*更新聚类中心(即质心),mv 是类 Cv 的中心,nk=|Ck|
4[收敛否?]. 质心不再移动,则终止算法;否则返回步骤 2. ![]() 判断收敛
判断收敛
2004, Ding et al .[22] proposed a consistency retention K-means algorithm (K-means-CP). Neighbor consistency is an important concept in statistical pattern recognition, They extended the concept to data clustering, For any data point in a class, The k nearest neighbor and the k mutual nearest neighbor must be in this class. And they studied the nature of k nearest neighbor consistency of classes, Proposed kNN and kMN consistency enforcement and improvement algorithms, The consistency of class k nearest neighbor or class k is proposed as an important quality measure for data clustering. They experimented with 20 newsgroups on the Internet, It turns out, k nearest neighbor consistency, k mutual nearest neighbor consistency and the correct rate of algorithm clustering are improved significantly. Meanwhile, This also shows that local consistency information can help global clustering objective function optimization.
1[ Initialization]. randomly select K points as the center of the initial class (c1,c2,…,cK);
2[ Assigned nearest neighbor set]. Assign a set of nearest neighbors S;//* assign S to the nearest class Cp,![]()
3[ Update Class Center].![]() //* update the cluster center (i.e. centroid), mv is the center and nk=|Ck| of class Cv
//* update the cluster center (i.e. centroid), mv is the center and nk=|Ck| of class Cv
4[ Convergence? ]. If the centroid no longer moves, the algorithm is terminated; otherwise, step 2. is returned.![]() Judging convergence
Judging convergence2.2.5 模糊聚类算法
2.2.5 fuzzy clustering algorithm
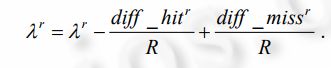
属性特征权值的计算方法为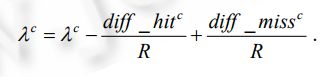
从而修正目标函数为![]()
当 J(W,P)最小时,聚类结果最优.NFWFCA 还可以将模糊 K-均值、K-modes 和 K-原型等算法合而为一.当λc=0 时,对应加权模糊 K-均值算法;当λr=0 时,对应加权模糊 K-modes 算法;当λc≠0 且λr≠0 时,对应加权模糊 K原型算法.
The calculation method of attribute feature weights is
So the objective function is modified![]()
2.2.6 图论算法
2.2.6 graph theory algorithm
2.3 基于网格和密度的聚类算法
2.3 Clustering Algorithm Based on Grid and Density
2.4 其他聚类算法
2.4 Other clustering algorithms
2.4.1 ACODF 聚类算法
2.4.1 ACODF clustering algorithm
(1) 应用不同偏好的(favorable)ACO 策略.每个蚂蚁只需访问全部城市数的十分之一,并且访问城市数目逐次减少;几次循环之后,两点间相对短的路径的信息素浓度增加,两点间相对长的路径的信息素减少.因此,蚂蚁喜欢访问距离近的节点,并用自己的信息素加强此路径(由其喜欢访问的节点组成);最后形成具有较高浓度的路径,即聚类完成.
nf(t+1)=2×ns(t)/3−i×ns(t)/(run×3),其中,nf 是蚁群在 T1 函数期间访问的节点数,nf(t+1)表示蚁群当前访问的节点数,nf(t)表示上一次循环蚁群访问的节点数,run=2,i∈{1,2}.3 实 验
3 Experiment
3.1 数据集
3.1 Data sets
3.2 针对分类属性数据的实验
3.2 Experiments on classified attribute data
3.2.1 大豆疾病数据实验
3.2.1 Soybean Disease Data Experiment
![]()
ai 是出现在第 i 个类簇(执行算法得到的)及其对应的类(初始类)中的样本数,k 是类数(这里有 k=4,聚类数),n 是数据集中样本总数(即 47).实验结果见表 1 和表 2.

从大豆疾病数据集的实验结果来看,迭代初始点集求精 K-modes 算法明显好于 K-modes 算法,两者的平均正确率分别为 92.6%和 84%.从算法运行时间来看,迭代初始点集求精 K-modes 算法所需时间略长.![]() ai is the number of samples that appear in the i class cluster (obtained by the execution algorithm) and its corresponding class (initial class), k is the number of classes (here k=4, cluster number), n is the total number of samples in the dataset (i.e .47). The experimental results are shown in tables 1 and 2.
ai is the number of samples that appear in the i class cluster (obtained by the execution algorithm) and its corresponding class (initial class), k is the number of classes (here k=4, cluster number), n is the total number of samples in the dataset (i.e .47). The experimental results are shown in tables 1 and 2.
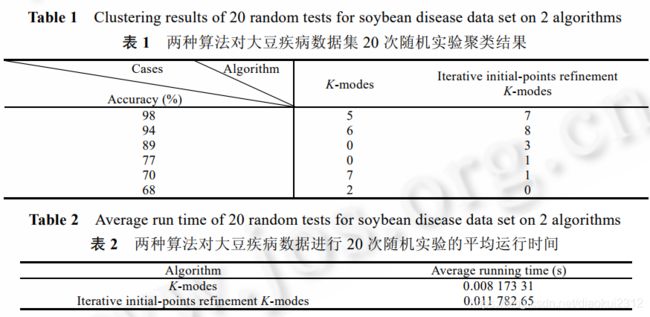
The experimental results of soybean disease data set show that the iterative initial point set refinement K-modes algorithm is obviously better than the K-modes algorithm, and the average accuracy of the two algorithms is 92.6% and 84%, respectively. From the point of view of the running time of the algorithm, it takes a little longer to refine the iterative initial point set K-modes the algorithm.3.2.2 动物园数据实验
3.2.2 Zoo Data Experiment
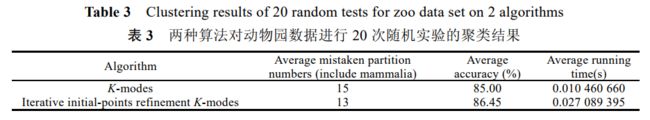
从以上实验结果可以得出,大豆集的分类效果整体好于动物园数据集,这与大豆集数据线性可分而动物园数据线性不可分是一致的.对于大豆集和动物园两个数据集,迭代初始点集求精 K-modes 算法的分类正确率都好于 K-modes 算法,这说明初始化时选择一个接近真实 modes 的初始值,通过不断迭代更容易得到正确的聚类结果.另外,从运行时间来看,迭代初始点集求精 K-modes 算法的运行时间比 K-modes 算法长一些.
From the above experimental results, it can be concluded that the classification effect of soybean set is better than that of zoo data set, which is consistent with the linear separability of soybean set data and the linear indivisibility of zoo data. The classification accuracy of iterative initial point set refinement K-modes algorithm is better than that of K-modes algorithm for soybean set and zoo data set, which indicates that an initial value close to the real modes is selected during initialization. It is easier to get the correct clustering results by iteration. Moreover, from the point of view of running time, the iterative initial point set refinement K-modes the algorithm runs longer than the K-modes algorithm.3.3 针对数值型数据进行实验
3.3 Experiments on numerical data
3.3.1 层次聚合算法和 K-means 算法比较
3.3.1 hierarchical aggregation algorithm and K-means algorithm
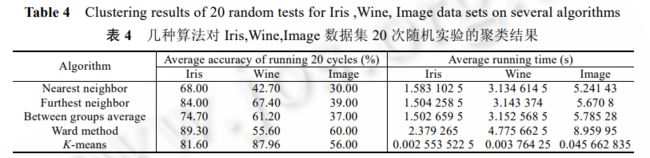
实验结果表明,传统层次聚合算法对聚类结构好的 Wine 数据集分类结果并不理想,这与传统层次聚合算法的再分配能力差相关(即若在初始阶段把一些数据分配给某个类簇,那么这些数据就不能再被分配给其他类簇);而对于 Image 数据集来讲,无论层次聚合算法还是 K-means 算法都基本上不能对其进行正确分类,这可能与Image 数据集的聚类结构等有关系;K-means 的运行效率远高于传统层次聚合算法.我们还发现,聚类结果有其不可预见性,对于不同数据集合,同一算法的聚类正确率可能会大不相同;对于同一数据集合,采用不同的聚类算法,其聚类结果和效率也会有很大差异.因此在实际应用中,应根据待聚类数据集的数据类型、聚类结构(若可得到的话)选择相应的聚类算法,以取得最佳聚类效果.
The experimental results show that the traditional hierarchical aggregation algorithm is not ideal for the classification of Wine data sets with good clustering structure, which is related to the poor redistribution ability of the traditional hierarchical aggregation algorithm (that is, if some data is allocated to a cluster in the initial stage, Then the data can not be assigned to other clusters. We also find that the clustering results are unpredictable, the clustering accuracy of the same algorithm may be very different for different data sets, and for the same data set, different clustering algorithms are used. The clustering results and efficiency will also be very different. Therefore, in practical application, the corresponding clustering algorithm should be selected according to the data type, clustering structure (if available) of the data set to be clustered, so as to obtain the best clustering effect.3.3.2 k 最近邻一致性强制与保留算法 K-means-CP 关于不同 K 值的实验
3.3.2 k experiments on different K values K-means-CP neighbor consistency enforcement and retention algorithms
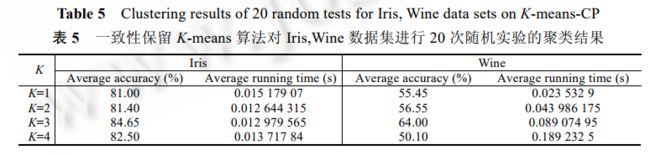
Select Iris and Wine numerical property data sets, For the K-means-CP algorithm (using Euclidean distance similarity calculation), K take 1~4, carried out 20 random experiments respectively. The results (see table 5) show that, Whether it’s data set Iris or Wine, data set All reached the highest correct rate at K=3. For Iris, data set K= correct rate was 84.65% at 3; For Wine, data set At K=3, the correct rate was 64.00. this shows that the K-means-CP algorithm has a certain prediction function for the initial classification number of data sets. In addition, The clustering results depend largely on the similarity measurement method used.3.4 K-means算法与k最近邻一致强制和保留算法比较
3.4 Comparison between K-means algorithm and k nearest neighbor consistent constraint and retention algorithm
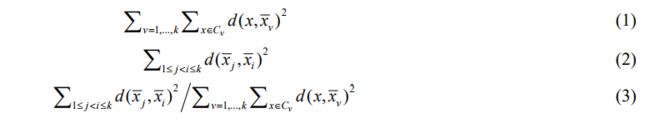
其中,k 为聚类结果包含的类簇数,Cv 表示类簇 v, v x 表示 Cv 的质心, ,j i x x 分别表示类簇 j 和 i 的质心,d 为距离函数.这里的质量只有相对意义,对相同算法不同数据集“质量值”间的相互比较没有意义.实验结果见表 6.实验结果表明,从聚类正确率和总体质量来看,k 最近邻一致强制和保留算法不优于 K-means 算法,kNN 一致性与聚类质量无关.
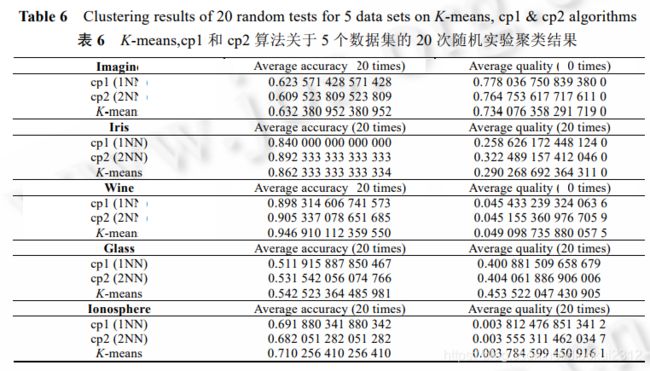
To determine whether the k nearest neighbor consistency constraint and retention algorithm is significantly superior to the K mean (K-means) algorithm, the relationship between kNN consistency and clustering quality, This paper aims at K-means algorithm ,1 nearest neighbor consistent constraint algorithm (k=1, which are abbreviated as cp1 algorithm and 2 nearest neighbor consistent forcing and retention algorithm (k=2, abbreviated as cp2 algorithm), Concerning Imagine, Iris, Wine, Glass, 20 random clustering experiments were carried out on Ionosphere equal numerical data sets. The accuracy and quality of clustering results are evaluated. The overall quality (quality) can be measured by the ratio of inter-class differences to intra-class differences. The compactness of a class of clusters can be characterized by the sum of squares of the distance between each data in the cluster to the centroid of the cluster. For the whole cluster, the intra-cluster difference, the inter-cluster difference and the total mass are calculated by the following formula (1)~(3) respectively:
Among them, k is the number of clusters contained in the clustering results, Cv represents cluster v, v x means Cv centroid, j i x x represent cluster j and i centroids, d as a distance function. The quality here is only relative, The comparison of “quality values” between different data sets of the same algorithm is meaningless. The experimental results are shown in Table 6. The experimental results show that, In terms of clustering accuracy and overall quality, k nearest neighbor consistent enforcement and retention algorithm is not superior to K-means algorithm, kNN consistency is independent of clustering quality.
4 结 论
4 Conclusion
文献[4]对 11 种算法采用 4 个知名数据集进行实验.其中,4 个数据集由 2 个类属性数据集和 2 个数值型数据集组成,由于对 K-means 和传统层次化算法采用了欧式距离作为相似性度量函数,所以针对 2 个类属性数据集所得到的测试结果不宜作为分析的依据.实验结果:对所选的 2 个数值型数据集,非层次化算法的分类结果优于层次化算法;对相同数据集,不同聚类算法产生了不同的聚类结果;对同一种算法、不同的数据集,其聚类的正确率不同.
Document [4] four well-known data sets are used to experiment 11 algorithms. Among them, four data sets are composed of two class attribute data sets and two numerical data sets. Because Euclidean distance is used as similarity measure function for K-means and traditional hierarchical algorithms, the test results obtained for two class attribute data sets should not be used as the basis for analysis. experimental results: for the two selected numerical data sets, the classification results of the non-leveling algorithm are better than the hierarchical algorithm; for the same data set, different clustering algorithms produce different clustering results; for the same algorithm, different data sets, the correct rate of clustering is different.致谢
Acknowledgement