单变量线性回归(披萨案例)
文章目录
- 前言
- 一、单变量线性回归
- 二、代码
- 三、总结
前言
在研究机器学习,发现了一些宝藏算法,写下来让自己记住,超有用!同时也想要分享给大家,如果喜欢可以支持一下,谢谢。一、单变量线性回归
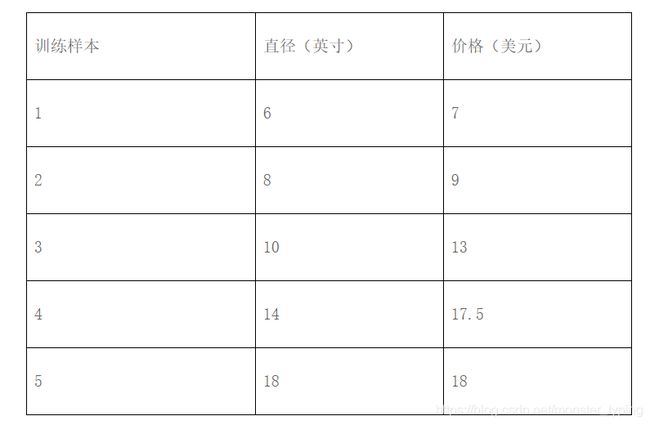
假设某披萨店的披萨价格和披萨直径之间有下列数据关系:

根据上面的训练数据,预测12英寸的披萨的可能售价。
  直径为自变量X,价格为因变量y,画出二者的散点图,并给出结论。

  根据现有的训练数据求线性回归模型,并画出拟合直线。(可以使用sklearn库中的sklearn.linear_model.LinearRegression对象来进行线性拟合),给出拟合直线方程。
预测测12英寸披萨的价格。(使用predict函数)
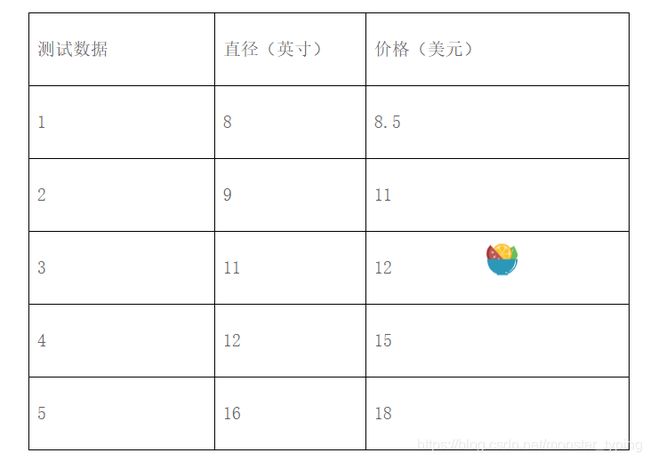
评价模型的准确率,分析模型预测结果
训练线性模型的步骤:
准备训练数据
创建模型
对象拟合求线性方程的截距和斜率
画拟合直线
假设hpyTrain代表针对训练数据的预测y值,hpyTest代表针对测试数据的预测y值
训练数据残差平方和:ssResTrain = sum((hpyTrain -yTrain) ** 2)
测试数据残差平方和:ssResTest = sum((hpyTest -yTest) ** 2
测试数据偏差平方和:ssTotTest = sum((yTest -np.mean(yTest)) ** 2)
R方:Rsquare = 1 -ssResTest / ssTotTest
B. Python的LinearRegression对象提供的方法:
训练数据残差平方和:model._residues
R方:model.score(xTest,yTest)
二、代码
import matplotlib.pyplot as plt
from sklearn.linear_model import LinearRegression
lm =LinearRegression() #构建线性模型
x_train = [[6], [8], [10], [14], [18]]
y_train = [[7], [9], [13], [17.5], [18]]
x_test = [[8], [9], [11], [12], [16]]
y_test = [[8.5], [11], [12], [15], [18]]
lm.fit(x_train, y_train)#训练模型
plt.scatter(x_train, y_train, color=‘green’)
plt.plot(x_train, lm.predict(x_train), color=‘red’, linewidth=4) #画出回归直线
plt.xlabel(‘Diam’)
plt.ylabel(‘Price’)
plt.title(‘TestImg’)
plt.show()
plt.scatter(x_test, y_test, color=‘green’)
plt.plot(x_test, lm.predict(x_test), color=‘red’, linewidth=4) #画出回归直线
plt.xlabel(‘Diam’)
plt.ylabel(‘Price’)
plt.title(‘PredictImg’)
plt.show()
PredictPrice = lm.predict(12)
print(‘twelve inch pizza price %d’ % PredictPrice)
print('model score = ', lm.score(x_test, y_test))
以上代码全部复制进python环境即可运行,亲测有效
三、总结
python库很强大,短短几句话就完事了。
但是如果你不知道有这几句话,你确实得找很久
希望我能帮你省些时间,喜欢的可以支持一下,谢谢啦~
