Coursera吴恩达机器学习课程 总结笔记及作业代码——第1,2周
- Linearregression
- 1 Model representation
- 2 Cost function
- 3 Gradient descent
- 4 Gradient descent for linear regression
- 1 Mul2ple features
- 2 Feature Scaling
- 3 Learningrate
- 4 Features and polynomial regression
- 5 Normal equa2on
- 编程作业
Linear’regression
发现这个教程是最入门的一个教程了,老师讲的很好,也很通俗,每堂课后面还有编程作业,全程用matlab编程,只需要填写核心代码,很适合自学。
1.1 Model representation
起始给出了预测房价的例子。 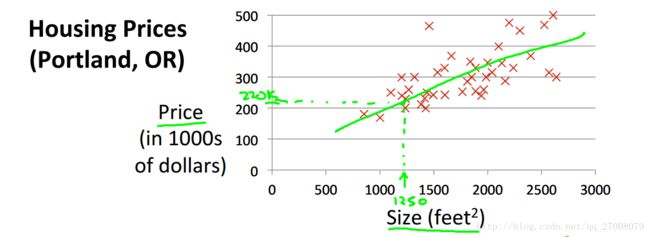
这个问题属于监督问题,每个样本都给出了准确的答案。
同时属于回归问题,对给定值预测实际输出。
定义(x(i),y(i))(x(i),y(i))为第i个样本,x表示输入值,y表示输出值,上标表示样本。
以下是机器学习运行模型 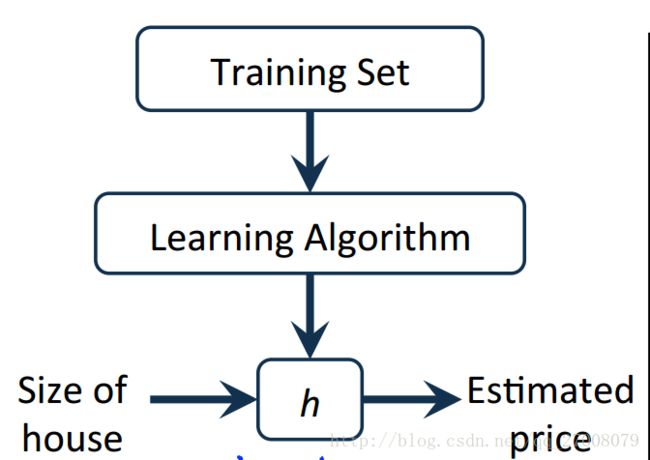
对于假设h我们可以用一条直线描述,用线性函数预测房价值。
hθ(x)=θ0+θ1∗xhθ(x)=θ0+θ1∗x
1.2 Cost function
我们取怎样的θθ值可以使预测值更加准确呢?
想想看,我们应使得每一个预测值和真实值差别不大,可以定义代价函数如下
J(θ0,θ1)=12m∑mi=1(hθ(x(i))−y(i))2J(θ0,θ1)=12m∑i=1m(hθ(x(i))−y(i))2
通过使J值取最小来满足需求
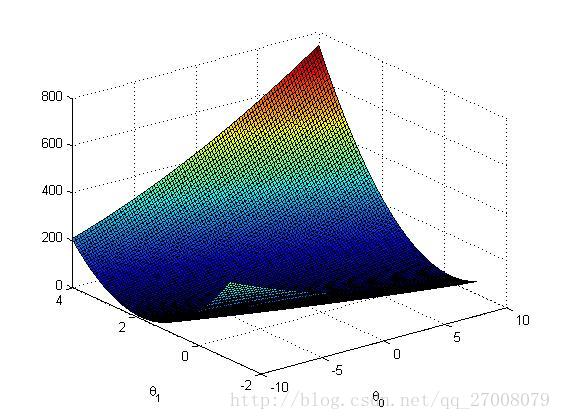
下面通过图形方式感受一下代价函数 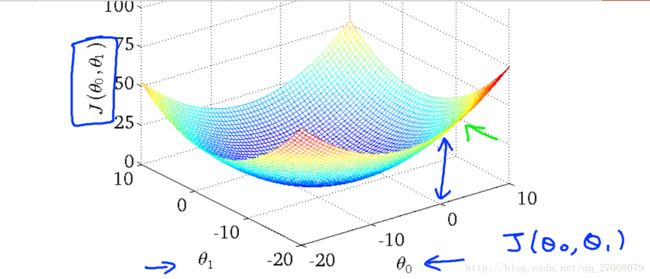
1.3 Gradient descent
怎样使我们的代价函数取得最小值呢
下面我们采取梯度下降法。 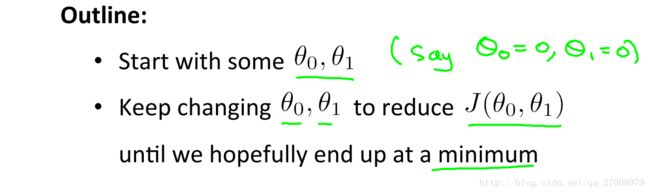
好比我们下山,每次在一点环顾四周,往最陡峭的路向下走,用图形的方式更形象的表示 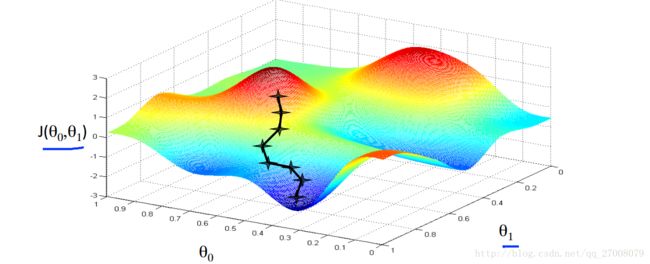
Gradient descent algorithm
repeat until convergence{
θj=θj−α∂∂θjJ(θ0,θ1)θj=θj−α∂∂θjJ(θ0,θ1) (for j=0 and j=1)(for j=0 and j=1)
}
注意更新theta值应同时更新,matlab中向量更新即为同时更新,所以应使上式向量化(之后会讲解向量化含义),也可采取下面方式 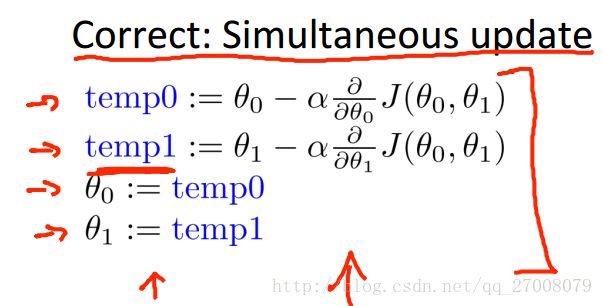
1.4 Gradient descent for linear regression
repeat until convergence{
θj=θj−α∂∂θjJ(θ0,θ1)θj=θj−α∂∂θjJ(θ0,θ1) (for j=0 and j=1)(for j=0 and j=1)
}
∂∂θjJ(θ0,θ1)==∂∂θj12m∑i=1m(hθ(x(i)−y(i)))2∂∂θj12m∑i=1m(hθ(θ0+θ1x)−y(i))2∂∂θjJ(θ0,θ1)=∂∂θj12m∑i=1m(hθ(x(i)−y(i)))2=∂∂θj12m∑i=1m(hθ(θ0+θ1x)−y(i))2
j=0:∂∂θjJ(θ0,θ1)=1m∑mi=1(hθ(x(i)−y(i)))j=0:∂∂θjJ(θ0,θ1)=1m∑i=1m(hθ(x(i)−y(i)))
j=1:∂∂θjJ(θ0,θ1)=1m∑mi=1(hθ(x(i)−y(i)))∗x(i)j=1:∂∂θjJ(θ0,θ1)=1m∑i=1m(hθ(x(i)−y(i)))∗x(i)
2.1 Mul2ple features
如果输入值不止一个,我们的假设函数应修改为
hθ(x)=θ0+θ1x1+θ2x2+⋯+θnxnhθ(x)=θ0+θ1x1+θ2x2+⋯+θnxn
为了结构统一,我们设 x0=1x0=1
hθ(x)=θ0+θ1x1+θ2x2+⋯+θnxn=θTxhθ(x)=θ0+θ1x1+θ2x2+⋯+θnxn=θTx 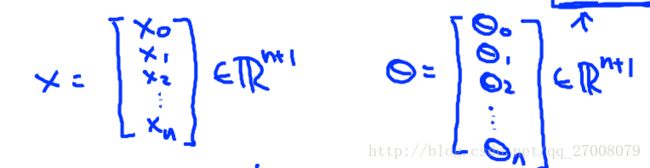
如此一来,便将变量向量化了
New algorithm
repeat until convergence{
θj=θj−α∂∂θjJ(θ)=θj−α1m∑mi=1(hθ(x(i)−y(i)))∗x(i)jθj=θj−α∂∂θjJ(θ)=θj−α1m∑i=1m(hθ(x(i)−y(i)))∗xj(i) (for j=0,1,2⋯n)(for j=0,1,2⋯n)
}
2.2 Feature Scaling
面对输入数据各个特征值范围差距过大的问题,我们可以对输入数据进行标准化。
x(j)i=x(j)i−avg(xi)Sixi(j)=xi(j)−avg(xi)Si
其中SiSi可以为标准差,也可以为max(xi)−min(xi)max(xi)−min(xi)
2.3 Learning’rate
- 如果αα太小,则梯度下降法会收敛缓慢
- 如果αα太大,则梯度下降法每次迭代可能不下降,最终导致不收敛。
2.4 Features and polynomial regression
除了线性回归外,我们也能采用多项式回归
举例如下假设函数
hθ(x)=θ0+θ1x+θ2x2+θ3x3hθ(x)=θ0+θ1x+θ2x2+θ3x3
我们可以定义为
hθ(x)=θ0+θ1x1+θ2x2+θ3x3=θ0+θ1x1+θ2x21+θ3x31hθ(x)=θ0+θ1x1+θ2x2+θ3x3=θ0+θ1x1+θ2x12+θ3x13
对于多项式回归,标准化更加重要。
2.5 Normal equa2on
除了梯度下降法,另一种求最小值的方式则是让代价函数导数为0,求θθ值
J(θ)=12m∑mi=1(hθ(x(i))−y(i))2J(θ)=12m∑i=1m(hθ(x(i))−y(i))2
∂∂θjJ(θ)=0∂∂θjJ(θ)=0 for every j
求得: θ=(XTX)−1XTyθ=(XTX)−1XTy
下面这个图比较了两个算法之间的区别 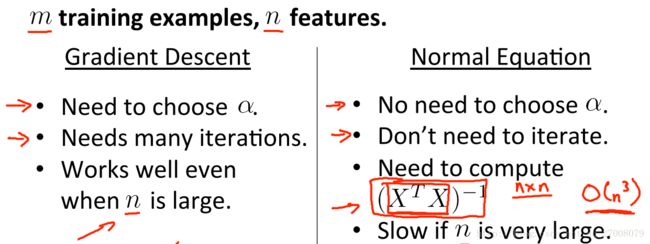
特殊情况:
由于用标准方程法时,涉及到要计算矩阵XTX的逆矩阵。但是XTX的结果有可能不可逆。 当使用python的numpy计算时,其会返回广义的逆结果。 主要原因: 出现这种情况的主要原因,主要有特征值数量多于训练集个数、特征值之间线性相关(如表示面积采用平方米和平方公里同时出现在特征值中)。 因此,首先需要考虑特征值是否冗余,并且清除不常用、区分度不大的特征值。对于 (XTX)(XTX)不可逆的情况下,我们可以采取减少特征量和使用正规化方式来改善。
比较标准方程法和梯度下降法:
这两个方法都是旨在获取使代价函数值最小的参数θ,两个方法各有优缺点:
1)梯度下降算法
优点:当训练集很大的时候(百万级),速度很快。
缺点:需要调试出合适的学习速率α、需要多次迭代、特征值数量级不一致时需要特征缩放。
2)标准方程法:
优点:不需要α、不需要迭代、不需要特征缩放,直接解出结果。
缺点:运算量大,当训练集很大时速度非常慢。
综合:因此,当训练集百万级时,考虑使用梯度下降算法;训练集在万级别时,考虑使用标准方程法。在万到百万级区间时,看情况使用,主要还是使用梯度下降算法。
编程作业
ex1.m
%% Machine Learning Online Class - Exercise 1: Linear Regression
% Instructions
% ------------
%
% This file contains code that helps you get started on the
% linear exercise. You will need to complete the following functions
% in this exericse:
%
% warmUpExercise.m
% plotData.m
% gradientDescent.m
% computeCost.m
% gradientDescentMulti.m
% computeCostMulti.m
% featureNormalize.m
% normalEqn.m
%
% For this exercise, you will not need to change any code in this file,
% or any other files other than those mentioned above.
%
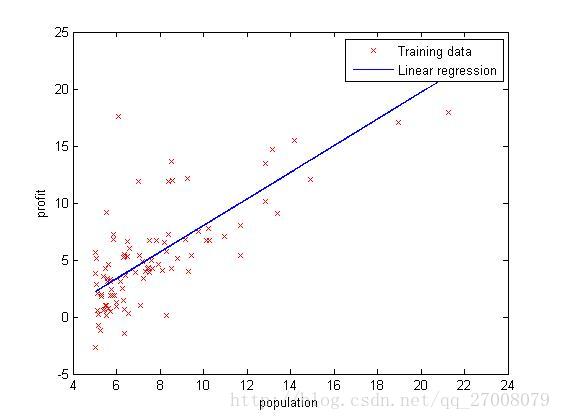
% x refers to the population size in 10,000s
% y refers to the profit in $10,000s
%
%% Initialization
clear ; close all; clc
%% ==================== Part 1: Basic Function ====================
% Complete warmUpExercise.m
fprintf('Running warmUpExercise ... \n');
fprintf('5x5 Identity Matrix: \n');
warmUpExercise()
fprintf('Program paused. Press enter to continue.\n');
pause;
%% ======================= Part 2: Plotting =======================
fprintf('Plotting Data ...\n')
data = load('ex1data1.txt');
X = data(:, 1); y = data(:, 2);
m = length(y); % number of training examples
% Plot Data
% Note: You have to complete the code in plotData.m
plotData(X, y);
fprintf('Program paused. Press enter to continue.\n');
pause;
%% =================== Part 3: Cost and Gradient descent ===================
X = [ones(m, 1), data(:,1)]; % Add a column of ones to x
theta = zeros(2, 1); % initialize fitting parameters
% Some gradient descent settings
iterations = 1500;
alpha = 0.01;
fprintf('\nTesting the cost function ...\n')
% compute and display initial cost
J = computeCost(X, y, theta);
fprintf('With theta = [0 ; 0]\nCost computed = %f\n', J);
fprintf('Expected cost value (approx) 32.07\n');
% further testing of the cost function
J = computeCost(X, y, [-1 ; 2]);
fprintf('\nWith theta = [-1 ; 2]\nCost computed = %f\n', J);
fprintf('Expected cost value (approx) 54.24\n');
fprintf('Program paused. Press enter to continue.\n');
pause;
fprintf('\nRunning Gradient Descent ...\n')
% run gradient descent
theta = gradientDescent(X, y, theta, alpha, iterations);
% print theta to screen
fprintf('Theta found by gradient descent:\n');
fprintf('%f\n', theta);
fprintf('Expected theta values (approx)\n');
fprintf(' -3.6303\n 1.1664\n\n');
% Plot the linear fit
hold on; % keep previous plot visible
plot(X(:,2), X*theta, '-')
legend('Training data', 'Linear regression')
hold off % don't overlay any more plots on this figure
% Predict values for population sizes of 35,000 and 70,000
predict1 = [1, 3.5] *theta;
fprintf('For population = 35,000, we predict a profit of %f\n',...
predict1*10000);
predict2 = [1, 7] * theta;
fprintf('For population = 70,000, we predict a profit of %f\n',...
predict2*10000);
fprintf('Program paused. Press enter to continue.\n');
pause;
%% ============= Part 4: Visualizing J(theta_0, theta_1) =============
fprintf('Visualizing J(theta_0, theta_1) ...\n')
% Grid over which we will calculate J
theta0_vals = linspace(-10, 10, 100);
theta1_vals = linspace(-1, 4, 100);
% initialize J_vals to a matrix of 0's
J_vals = zeros(length(theta0_vals), length(theta1_vals));
% Fill out J_vals
for i = 1:length(theta0_vals)
for j = 1:length(theta1_vals)
t = [theta0_vals(i); theta1_vals(j)];
J_vals(i,j) = computeCost(X, y, t);
end
end
% Because of the way meshgrids work in the surf command, we need to
% transpose J_vals before calling surf, or else the axes will be flipped
J_vals = J_vals';
% Surface plot
figure;
surf(theta0_vals, theta1_vals, J_vals)
xlabel('\theta_0'); ylabel('\theta_1');
% Contour plot
figure;
% Plot J_vals as 15 contours spaced logarithmically between 0.01 and 100
contour(theta0_vals, theta1_vals, J_vals, logspace(-2, 3, 20))
xlabel('\theta_0'); ylabel('\theta_1');
hold on;
plot(theta(1), theta(2), 'rx', 'MarkerSize', 10, 'LineWidth', 2);
ComputeCost.m
gradientDescent.m
function [theta, J_history] = gradientDescent(X, y, theta, alpha, num_iters)
%GRADIENTDESCENT Performs gradient descent to learn theta
%   theta = GRADIENTDESCENT(X, y, theta, alpha, num_iters) updates theta by
%   taking num_iters gradient steps with learning rate alpha

% Initialize some useful values
m = length(y); % number of training examples
J_history = zeros(num_iters, 1);

for iter = 1:num_iters

    % ====================== YOUR CODE HERE ======================
    % Instructions: Perform a single gradient step on the parameter vector
    %               theta.
    %
    % Hint: While debugging, it can be useful to print out the values
    %       of the cost function (computeCost) and gradient here.
    %

    theta = theta - alpha/m*X'*(X*theta - y);

    % ============================================================

    % Save the cost J in every iteration
    J_history(iter) = computeCost(X, y, theta);

end

end