Kaggle实战:Store Sales - Time Series Forecasting
(菜鸡梦呓,大佬轻喷)
数据浏览
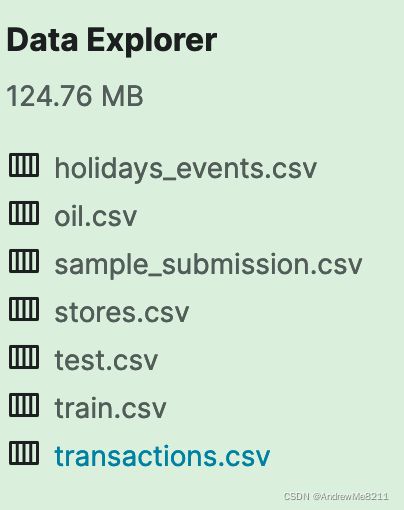
train.csv
The training data, comprising time series of features store_nbr, family, and onpromotion as well as the target sales.
- store_nbr identifies the store at which the products are sold.
- family identifies the type of product sold.
- sales gives the total sales for a product family at a particular store at a given date. Fractional values are possible since products can be sold in fractional units (1.5 kg of cheese, for instance, as opposed to 1 bag of chips).
- onpromotion gives the total number of items in a product family that were being promoted at a store at a given date.
test.csv
The test data, having the same features as the training data. You will predict the target sales for the dates in this file.
The dates in the test data are for the 15 days after the last date in the training data.
sample_submission.csv
A sample submission file in the correct format.
stores.csv
Store metadata, including city, state, type, and cluster.
cluster is a grouping of similar stores.
oil.csv
Daily oil price. Includes values during both the train and test data timeframes. (Ecuador is an oil-dependent country and it’s economical health is highly vulnerable to shocks in oil prices.)
holidays_events.csv
Holidays and Events, with metadata
- NOTE: Pay special attention to the transferred column. A holiday that is transferred officially falls on that calendar day, but was moved to another date by the government. A transferred day is more like a normal day than a holiday. To find the day that it was actually celebrated, look for the corresponding row where type is Transfer. For example, the holiday Independencia de Guayaquil was transferred from 2012-10-09 to 2012-10-12, which means it was celebrated on 2012-10-12. Days that are type Bridge are extra days that are added to a holiday (e.g., to extend the break across a long weekend). These are frequently made up by the type Work Day which is a day not normally scheduled for work (e.g., Saturday) that is meant to payback the Bridge.
- Additional holidays are days added a regular calendar holiday, for example, as typically happens around Christmas (making Christmas Eve a holiday).
Additional Notes
- Wages in the public sector are paid every two weeks on the 15 th and on the last day of the month. Supermarket sales could be affected by this.
- A magnitude 7.8 earthquake struck Ecuador on April 16, 2016. People rallied in relief efforts donating water and other first need products which greatly affected supermarket sales for several weeks after the earthquake.
总结
稍微总结一下,现有的可用数据如下:
在train.csv中
每一个货物有这些特征:
- store_nbr:所在商店
- family:所属商品类型
- sales:所属商品类型在货物所在商店当日的销售额
- onpromotion:所属商品类型在货物所在商店当日的进货数量
在stores.csv中
每一个商店有如下特征:
- city:所在城市
- state:所在州
- type:类型
- cluster:聚类,也就是一群类似的商店抱的团(只不过不知道哪里类似…)
在oil.csv中
每天的油价dcoilwtico
在holidays_events.csv中
- date:日期
- type:类型,包括节假日holiday,时间Event等等
- locale:事件范围,全国的,本地的等等
- locale_name:事件范围的地点,如果是国家性的就对应厄瓜多尔,如果是某个地方的节日就对应某个地方
- description:描述,也就是节日的名字
- transferred:是否是推迟后的节日。如果是推迟后的,那么就没那么重要了
在transactions.csv中
就是每天的交易额
其他
-
test.csv:训练好模型后就用这里面的数据来求答案了
-
sample_submission.csv:一个答案的格式示例
数据清洗和特征工程
先读入数据:
def ReadInData(file):
    path = 'store-sales-time-series-forecasting/'
    return pd.read_csv(path + file)

df_holidays_events = ReadInData('holidays_events.csv')
df_oil = ReadInData('oil.csv')
df_stores = ReadInData('stores.csv')
df_train = ReadInData('train.csv')
df_test = ReadInData("test.csv")
df_transactions = ReadInData('transactions.csv')
缺失值处理
oil.csv中dcoilwtico属性下有一部分缺失值,观察油价图形:
def DrawLine(X_data, Y_data):
    fig = plt.figure()
    axes = fig.add_subplot(1, 1, 1)
    axes.plot(X_data, Y_data)
    plt.show()
DrawLine(df_oil['date'], df_oil['dcoilwtico'])
发现油价变动较大
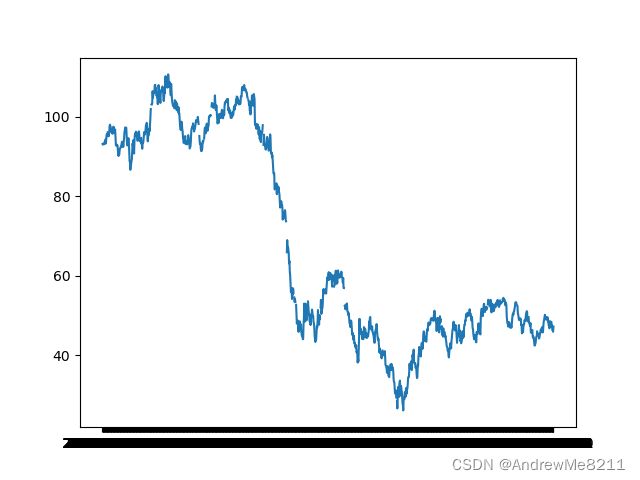
因此使用平均值来填充意义不大,因此使用前一个数据填充:
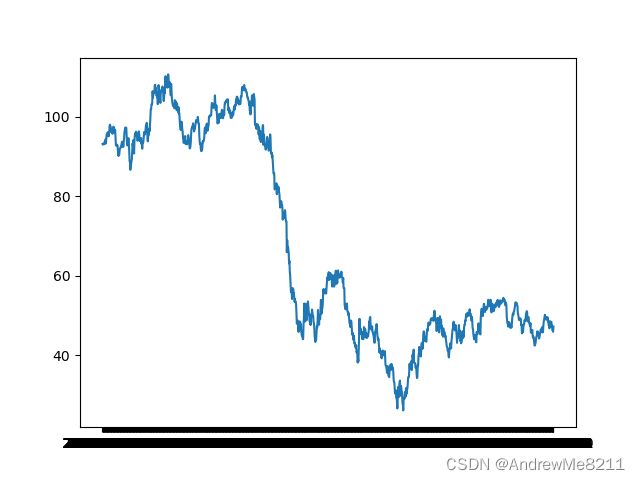
df_oil_withoutNA = df_oil.fillna(method="pad")
DrawLine(df_oil_withoutNA['date'], df_oil_withoutNA['dcoilwtico'])
特征整合
观察发现在其他的文件里面有一些可以整合到训练集(train.csv)和测试集(test.csv)里面的特征:
- stores.csv中的city,state,type,cluster
- oil.csv中的dcoilwtico
- holidays_events.csv中的locale,locale_name,description,transferred
- transaction中的交易额
因此先对其他文件里面的索引重命名,然后使用merge函数对其进行合并操作:
def Add_Feature():
    df_holidays_events.rename(columns={'date': 'date',
                                       'type': 'Daily_holiday_type',
                                       'locale': 'Daily_holiday_locale',
                                       'locale_name': 'Daily_holiday_locale_name',
                                       'description': "Daily_holiday_description",
                                       'transferred': "Daily_holiday_transferred"},
                              inplace=True)
    df_stores.rename(columns={'store_nbr': 'store_nbr',
                              'city': 'stores_city',
                              'state': 'store_state',
                              'type': 'store_type',
                              'cluster': 'store_cluster'},
                     inplace=True)
    df_transactions.rename(columns={'transactions': 'Daily_transactions'})
    DfTrainNew = pd.merge(df_train, df_holidays_events, how='left', left_on='date', right_on='date')
    DfTestNew = pd.merge(df_test, df_holidays_events, how='left', left_on='date', right_on='date')
    DfTrainNew = pd.merge(DfTrainNew, df_oil_withoutNA, how='left', left_on='date', right_on='date')
    DfTestNew = pd.merge(DfTestNew, df_oil_withoutNA, how='left', left_on='date', right_on='date')
    DfTrainNew = pd.merge(DfTrainNew, df_stores, how='left', left_on='store_nbr', right_on='store_nbr')
    DfTestNew = pd.merge(DfTestNew, df_stores, how='left', left_on='store_nbr', right_on='store_nbr')
    DfTrainNew = pd.merge(DfTrainNew, df_transactions, how='left', on=['date', 'store_nbr'])
    DfTestNew = pd.merge(DfTestNew, df_transactions, how='left', on=['date', 'store_nbr'])
    return DfTrainNew, DfTestNew


res = Add_Feature()
df_train_New = res[0]
df_test_New = res[1]
操作完后,统计一下非NA值的个数,来看看数据合并的效果:
def LookIn(DF_In):
    print("length:{}".format(len(DF_In)))
    for i in DF_In.columns:
        a = DF_In[i].describe()
        print("Name:{} Rate:{}%".format(i, 100 * a['count'] / len(DF_In[i])))


print("df_train_New:>>>>>>")
LookIn(df_train_New)
print("df_test_New:>>>>>>")
LookIn(df_test_New)
print("df_test:>>>>>>")
LookIn(df_test)
效果稍微有点出乎意料:
df_train_New:>>>>>>
length:3054348
Name:id Rate:100.0%
Name:date Rate:100.0%
Name:store_nbr Rate:100.0%
Name:family Rate:100.0%
Name:sales Rate:100.0%
Name:onpromotion Rate:100.0%
Name:Daily_holiday_type Rate:16.45274212368728%
Name:Daily_holiday_locale Rate:16.45274212368728%
Name:Daily_holiday_locale_name Rate:16.45274212368728%
Name:Daily_holiday_description Rate:16.45274212368728%
Name:Daily_holiday_transferred Rate:16.45274212368728%
Name:dcoilwtico Rate:71.17852975495916%
Name:stores_city Rate:100.0%
Name:store_state Rate:100.0%
Name:store_type Rate:100.0%
Name:store_cluster Rate:100.0%
Name:transactions Rate:91.84385669216475%
df_test_New:>>>>>>
length:28512
Name:id Rate:100.0%
Name:date Rate:100.0%
Name:store_nbr Rate:100.0%
Name:family Rate:100.0%
Name:onpromotion Rate:100.0%
Name:Daily_holiday_type Rate:6.25%
Name:Daily_holiday_locale Rate:6.25%
Name:Daily_holiday_locale_name Rate:6.25%
Name:Daily_holiday_description Rate:6.25%
Name:Daily_holiday_transferred Rate:6.25%
Name:dcoilwtico Rate:75.0%
Name:stores_city Rate:100.0%
Name:store_state Rate:100.0%
Name:store_type Rate:100.0%
Name:store_cluster Rate:100.0%
Name:transactions Rate:0.0%
df_test:>>>>>>
length:28512
Name:id Rate:100.0%
Name:date Rate:100.0%
Name:store_nbr Rate:100.0%
Name:family Rate:100.0%
Name:onpromotion Rate:100.0%
不难发现,交易额合并后,测试集里面的所有样本都没有对应的销售额,因此销售额这个特征也许不应该这样用
之后看了看训练集数据后发现了一个更大的问题,就是经过增加特征后,训练集里面的样本数量变多了…花了一下午的时间才发现,原来同一天可以有很多节日…
很无语,只好暂时简单粗暴的去个重,有更好的办法就再说吧:
df_train_New.drop_duplicates(subset='id', keep='first', inplace=True)
当然还有一个问题,那就是大量的空缺值的问题。现阶段暂时先删掉这些东西:
df_train_New.dropna(axis=0, inplace=True)
下面也许可以先尝试一下建模,到时候再迭代修改就行
但是建模之前先要把数据映射一下,不然数据进不了机器学习模型的
数据映射
def PreWork():
    df_train_New.dropna(axis=0, inplace=True)
    df_train_New.drop_duplicates(subset='id', keep='first', inplace=True)
    df_train_New['date'] = df_train_New['date'].apply(lambda X: int(str(X).split('-')[0] +
                                                                    str(X).split('-')[1] +
                                                                    str(X).split('-')[2]))
    df_train_New['family'] = pd.factorize(df_train_New['family'])[0].astype(int)
    df_train_New['Daily_holiday_type'] = pd.factorize(df_train_New['Daily_holiday_type'])[0].astype(int)
    df_train_New['Daily_holiday_locale'] = pd.factorize(df_train_New['Daily_holiday_locale'])[0].astype(int)
    df_train_New['Daily_holiday_locale_name'] = pd.factorize(df_train_New['Daily_holiday_locale_name'])[0].astype(int)
    df_train_New['Daily_holiday_description'] = pd.factorize(df_train_New['Daily_holiday_description'])[0].astype(int)
    df_train_New['Daily_holiday_transferred'] = pd.factorize(df_train_New['Daily_holiday_transferred'])[0].astype(int)
    df_train_New['stores_city'] = pd.factorize(df_train_New['stores_city'])[0].astype(int)
    df_train_New['store_state'] = pd.factorize(df_train_New['store_state'])[0].astype(int)
    df_train_New['store_type'] = pd.factorize(df_train_New['store_type'])[0].astype(int)


PreWork()
建模
这个题给了每个商品很多特征,然后需要预测另外一些商品的价格。根据这个题的特点,发现可以先试一试决策树或者随机森林模型。至于题目里面说的时间序列预测…暂时还比较迷。
然后对训练集先用两个模型试试,然后使用MAE来评一下误差度:
def BuildDecisionTree(x_F, Y_F, DataLog):
    x_ = DataLog[x_F]
    Y_ = DataLog[Y_F]
    model = DecisionTreeRegressor(random_state=1, max_depth=100)
    a_x, b_x, a_y, b_y = train_test_split(x_, Y_, random_state=1)
    model.fit(a_x, a_y)
    predictions = model.predict(b_x)
    delta = mean_absolute_error(b_y, predictions)
    print("DecisionTree:mean_absolute_error delta:{}".format(delta))


def BuildRandomForest(x_F, Y_F, DataLog):
    x_ = DataLog[x_F]
    Y_ = DataLog[Y_F]
    model = RandomForestRegressor(random_state=1, max_depth=100)
    a_x, b_x, a_y, b_y = train_test_split(x_, Y_, random_state=1)
    model.fit(a_x, a_y)
    predictions = model.predict(b_x)
    delta = mean_absolute_error(b_y, predictions)
    print("RandomForest:mean_absolute_error delta:{}".format(delta))

X_Feature = ['id', 'date', 'store_nbr', 'family', 'onpromotion',
             'Daily_holiday_type', 'Daily_holiday_locale',
             'Daily_holiday_locale_name', 'Daily_holiday_description',
             'Daily_holiday_transferred', 'dcoilwtico', 'stores_city', 'store_state',
             'store_type', 'store_cluster', 'transactions']
Y_Feature = 'sales'
BuildRandomForest(X_Feature, Y_Feature, df_train_New)
BuildDecisionTree(X_Feature, Y_Feature, df_train_New)
当然随机森林不出意外的要精确一些:
RandomForest:mean_absolute_error delta:73.51907510982585
DecisionTree:mean_absolute_error delta:97.08605686543322
于是尝试用随机森林模型来预测一下测试集
def Forecast():
    model = RandomForestRegressor(random_state=1, max_depth=100)
    model.fit(df_train_New[X_Feature], df_train_New[Y_Feature])
    Aim = df_test_New[X_Feature]
    predictions = model.predict(Aim)
    res = pd.DataFrame(predictions)
    path = "store-sales-time-series-forecasting/submission.csv"
    res.to_csv(path)


Forecast()
然后把预测数据修改一下索引,放到kaggle上面去:
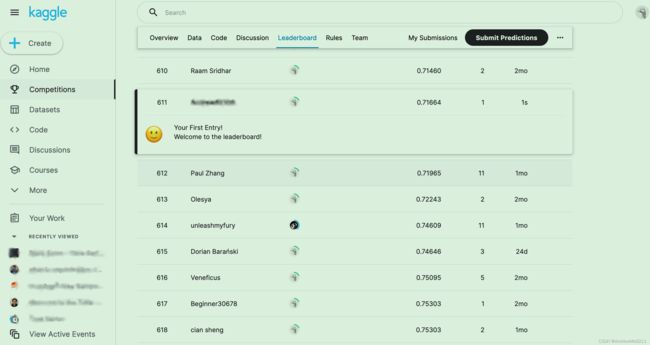
芜湖!