ggplot2-标度、坐标轴和图例8
离散型
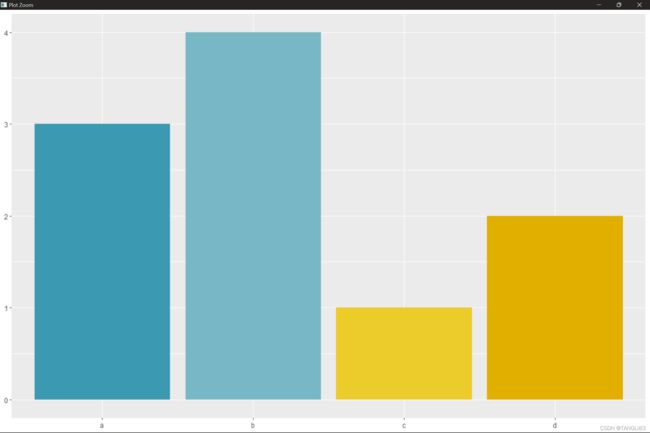
有4种颜色标度可以用于离散数据。用一个条形图来解释它们,条形图把位置和填充的信息一起编码到同一个变量
df <- data.frame(x = c("a", "b", "c", "d"), y = c(3, 4, 1, 2))
bars <- ggplot(df, aes(x, y, fill = x)) +
	geom_bar(stat = "identity") +
	labs(x = NULL, y = NULL) +
	theme(legend.position = "none")
默认的配色方案,scale_color_hue(),可以沿着HCL色轮选取均匀分布的色相来生成颜色。这种方案选取八种或以下颜色效果比较好,但是八种以上对于颜色就很难区分开了。可以使用h、c和l参数控制默认的彩度和明度,以及色相的范围
bars
bars + scale_fill_hue(c = 40)
bars + scale_fill_hue(h = c(180, 300))
默认配色的另外一个缺点是,由于所有颜色都拥有相同的明度和彩度,所以当进行黑白打印时,它们就会成为几近相同的灰影
scale_color_brewer使用精选的“ColorBrewer”配色,详情可见http://colorbrewer2.org/。它更专注于地图,不过它在展示较大面积时表现更佳
对于类别型数据中的点而言,可以选择调色板“Set1”和“Dark2”
对于面积则是“Set2”、“Pastel1”、“Pastel2”、“Accent”
RColorBrewer::display.brewer.all()可列出所有的调色板
bars + scale_fill_brewer(palette = "Set1")
bars + scale_fill_brewer(palette = "Set2")
bars + scale_fill_brewer(palette = "Accent")
scale_color_grey将离散数据映射到灰度中,从浅到深
bars + scale_fill_grey()
bars + scale_fill_grey(start = 0.5, end = 1)
bars + scale_fill_grey(start = 0, end = 0.5)
如果要用自制的离散型颜色标度,scale_color_manual是不错的选择。下面的例子展示了在wesanderson包中色彩系统是如何受Wes Anderson的电影的启发的。它们不是为了感知均匀性而这么设计的,仅仅是为了有意思!!!
library(wesanderson)
bars + scale_fill_manual(values = wes_palette("GrandBudapest1"))
bars + scale_fill_manual(values = wes_palette("Zissou1"))
bars + scale_fill_manual(values = wes_palette("Rushmore1"))
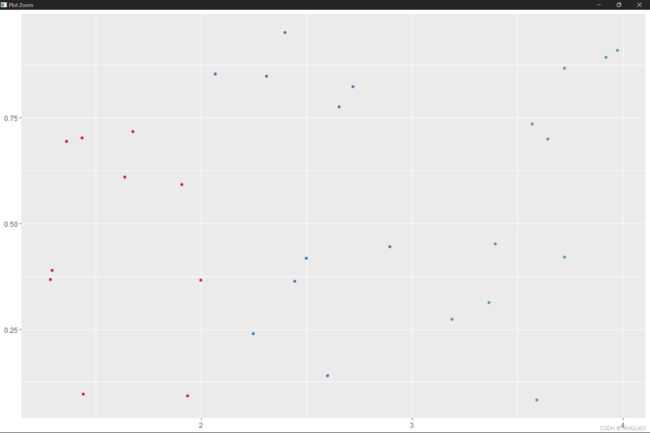
明亮的颜色适用于点,但是不适用于条形图。微妙的颜色适用于条形图,但是对点很不友好
# 明亮的颜色适用于点
df <- data.frame(x = 1:3 + runif(30), y = runif(30), z = c("a", "b", "c"))
point <- ggplot(df, aes(x, y)) +
	geom_point(aes(color = z)) +
	theme(legend.position = "none") +
	labs(x = NULL, y = NULL)
point + scale_color_brewer(palette = "Set1")
point + scale_color_brewer(palette = "Set2")
point + scale_color_brewer(palette = "Pastel1")
# 微妙的颜色更适用于区域
df <- data.frame(x = 1:3, y = 3:1, z = c("a", "b", "c"))
area <- ggplot(df, aes(x, y)) +
	geom_bar(aes(fill = z), stat = "identity") +
	theme(legend.position = "none") +
	labs(x = NULL, y = NULL)
area + scale_fill_brewer(palette = "Set1")
area + scale_fill_brewer(palette = "Set2")
area + scale_fill_brewer(palette = "Pastel1")


