第10讲 使用 SAS 制作统计分析报表
本节所用数据集:
链接:https://pan.baidu.com/s/1lV88p8DQLbpYIrRDJAJUyA
提取码:wpl0
一、tabulate 制表过程
1. 由分类变量、分析变量和统计量关键词组成的表达式构成描述性统计报表。
2. Tabulate 过程的 Table 语句的操作符(*、 、()、,)
(1)交叉连接项,即嵌套(使用*号)
(2)项与项之间的并列连接,即平行(使用空格)
(3)改变次序(使用())
(4)产生的报表最多三维:如果包含二维,次序为行、列。(维表达式间用逗号隔开;)
(5)用 <> 定义 Pctn 统计量的分母
- 分类变量必须在 class 语句中说明
- 分析变量必须在 var 语句中列出
3. proc tabulate 过程的其他语句
(1)missing选项:要求把缺失值作为分类变量的有效水平
(2)order = freq | data | internal | formatted
ps:规定报表中分类变量值出现的次序
- freq:按频数下降的次序
- data:按原数据集中出现的先后次序
- internal:按非格式化值的次序
- formatted:按格式化值的次序
4. label 语句用来对变量加标签
5. keylabel 语句用来对统计量加标签
6. 统计量:N(字符型变量的默认统计量),Nmiss,mean,std,min,range,sum(数值型变量默认统计量),var,pctn(频数n的百分数,后面参数为列变量则是行百分比,后面参数为行变量则是列百分比)
7. F 或 format 表示输出使用一定的格式,如:a*f = 8.2
8. 全类变量 all,当 all 嵌入某个交叉时,all 不考虑分类变量的水平,而用all 来生成子集和及总和。如:B*(A all)、(all B)*(all A)
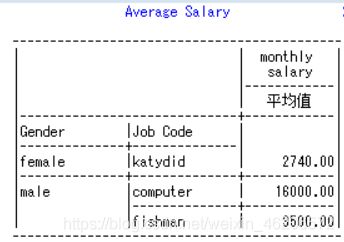
例1:tabulate
data fly;
input name $ gender $ jobcode $ salary;
cards;
a male   computer 10000
b female katydid   800
c male   fishman  3000
d female katydid  900
e male   computer 8000
f female katydid  1000
g male   fishman  5000
h female katydid  2000
i male   fishman  2500
j female katydid  9000
z male   computer 30000
;
run;

proc tabulate data=fly;
class gender jobcode;                      ## class 分类变量
var salary;                                ## var   分析变量
table gender*jobcode ,salary*mean;         ## 二维:行,列
keylabel mean='平均值';
label jobcode='Job Code'
gender='Gender'
salary='monthly salary';
title ;Average Salary';
footnote 'by zhao';
run;
例2:tabulate1
proc format;
value $city '1'='shenyang' '2'='anshan' '3'='fushan' '4'='benxi' '5'='yingkou';
value sex 1='male'2='female';
value nation 1='汉' 2='满' 3='朝鲜' 4='回' 5='其他';
run;

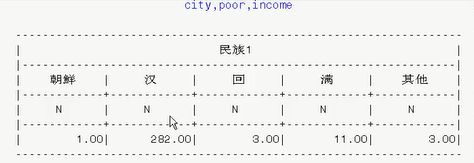
proc tabulate data=process.table order=formatted;
format city $city. sex sex. nation.;
title'city,poor,income';
class city poo2 sex nation;
footnote;
var ave_inco;
labelcity='Area';
keylabel sum='Total';
*table nation;
*table city,ave_inco;
*table city,poo2*ave_inco*mean;
*table city,poo2*ave_inco*(sum mean);
*table city,poo2*pctn;
*table city,poo2*pctn;
*table city,poo2*pctn;/*表格百分比*/
*table city,poo2,ave_inco;
*table city,poo2*(sum mean),ave_inco;
*table sex,city poo2,nation*ave_inco*mean;
*table (city ALL)*(poo2 all),*,ave_inco*mean;
run;


