数据分析课程笔记(三)数组形状和计算、numpy存储/读取数据、索引、切片和拼接
数据分析课程笔记
-
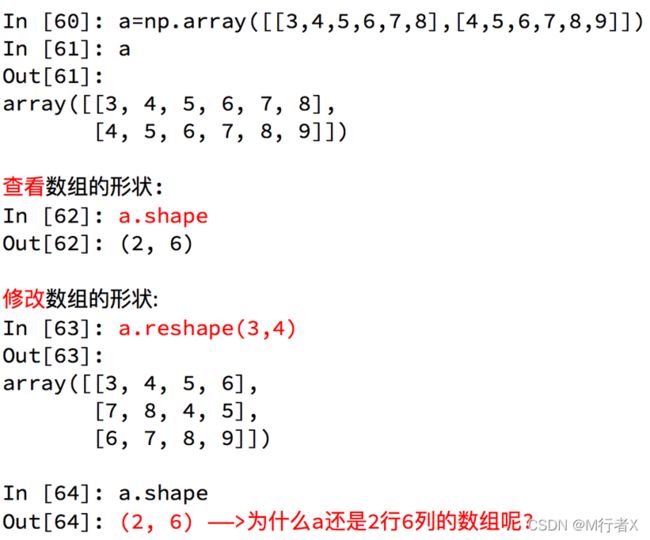
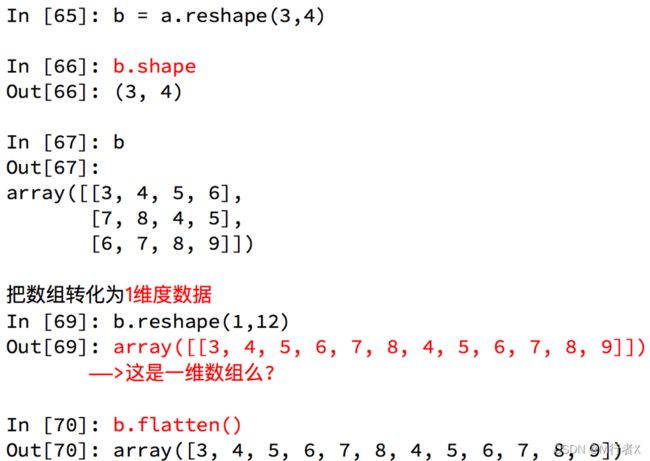
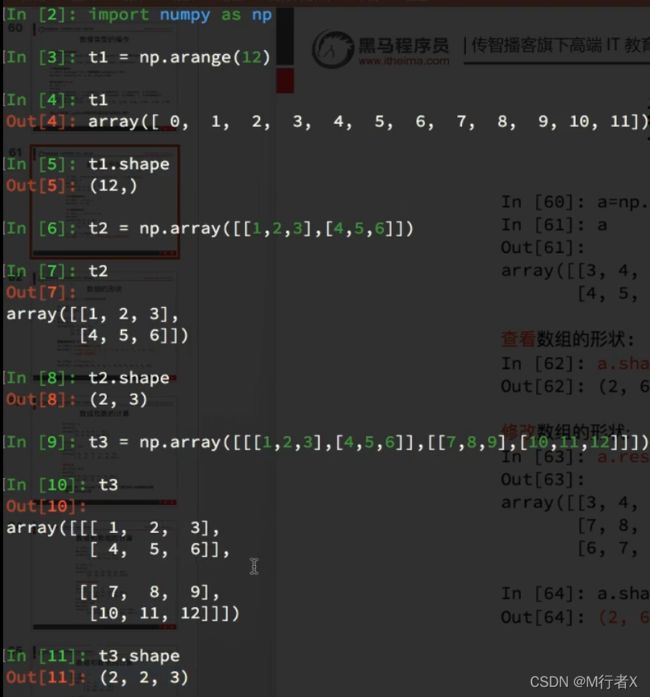
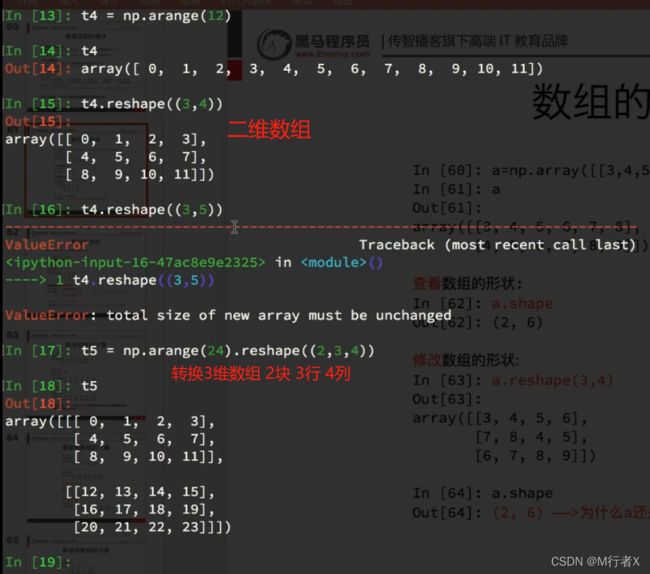
- 数组的形状
- 数组的计算
-
- 不同维度进行计算
- 广播原则
- 轴(axis)
- numpy读取数据
- numpy索引和切片
-
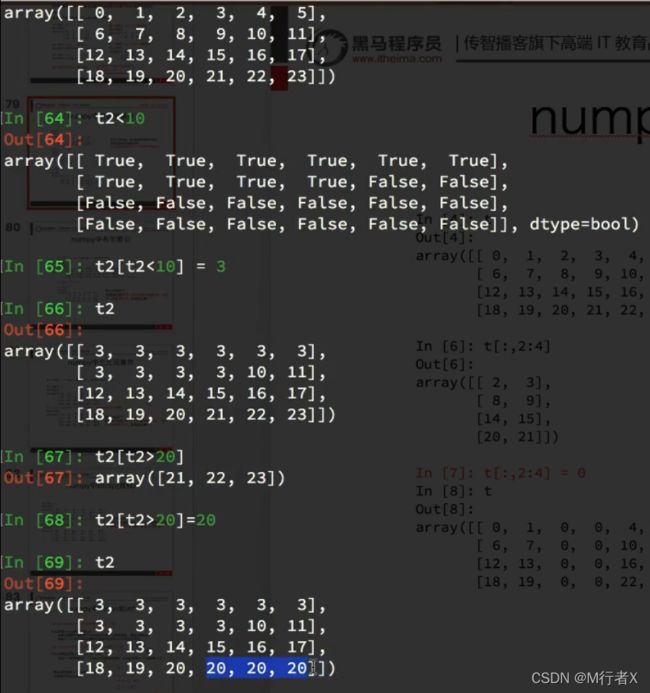
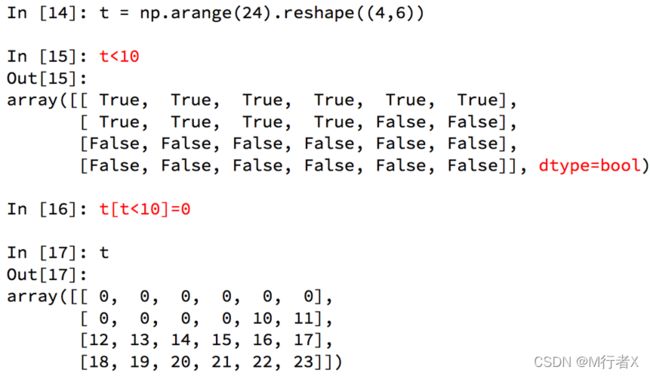
- numpy中布尔索引
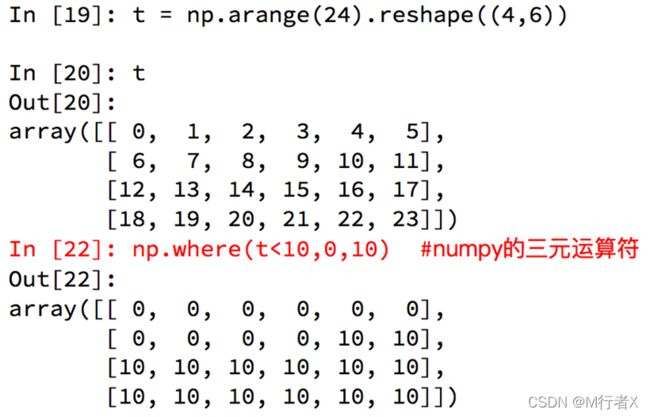
- numpy中三元运算符
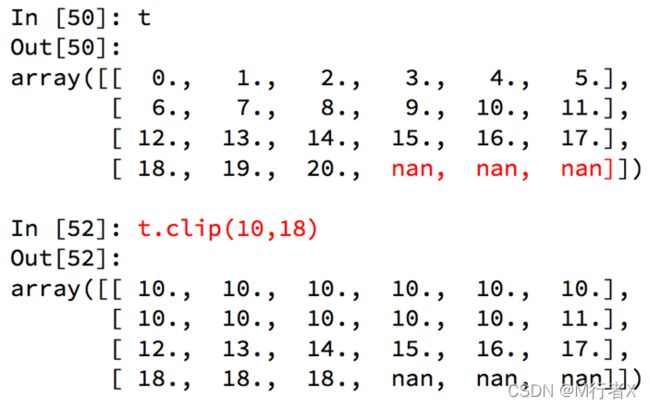
- numpy中的clip(裁剪)
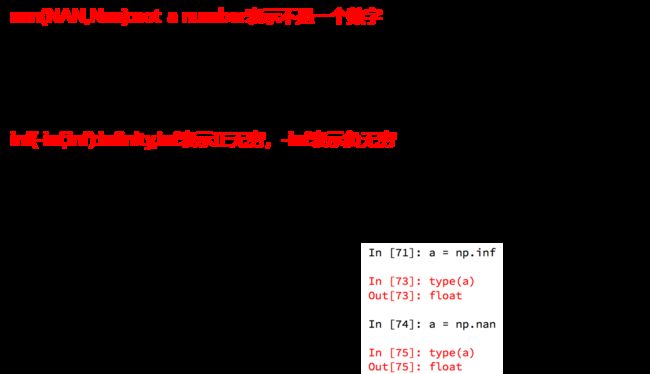
- numpy中的nan和inf
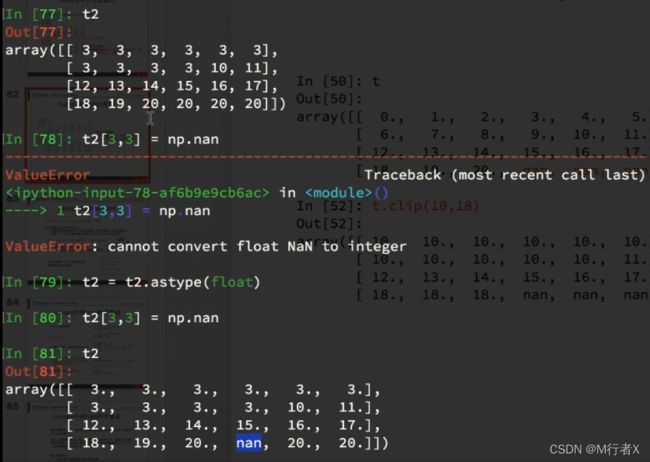
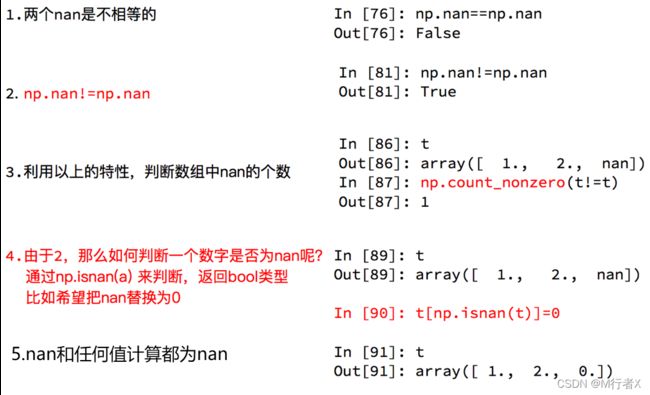
- numpy中的nan的注意点
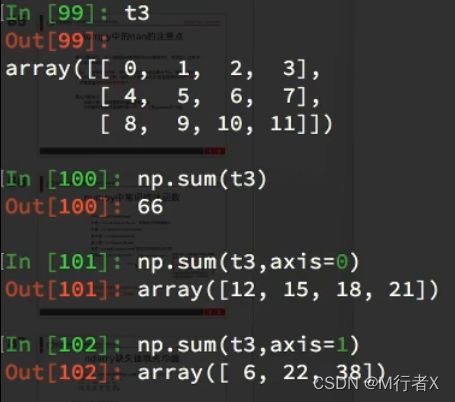
- numpy中常用统计函数
- 数据拼接
-
- 数据行列交换
- 更多好用方法
- numpy生成随机数
-
- numpy的注意点copy和view
数组的形状
数组的计算
不同维度进行计算
广播原则
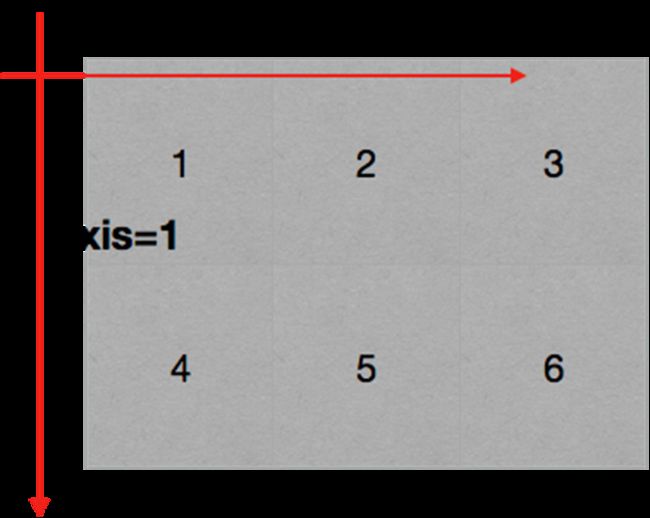
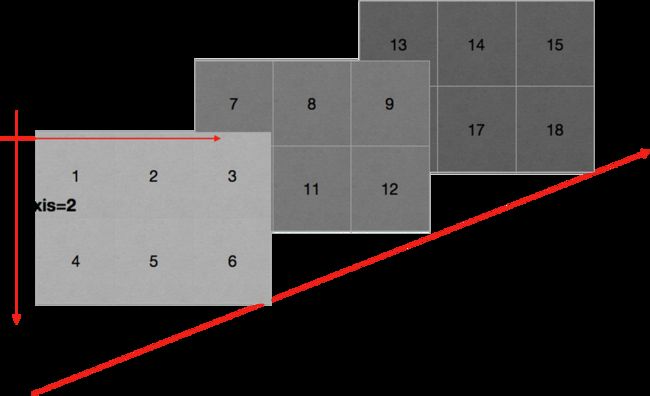
轴(axis)
numpy读取数据

np.loadtxt(fname,dtype=np.float,delimiter=None,skiprows=0,usecols=None,unpack=False)

数据来源:
https://www.kaggle.com/datasnaek/youtube/data
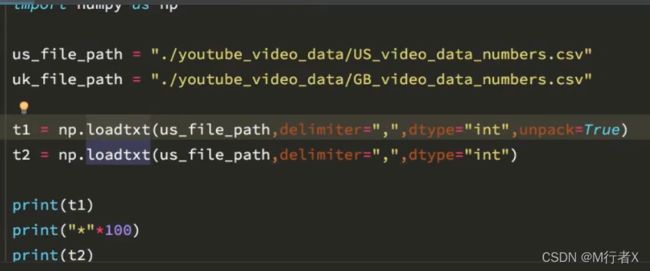
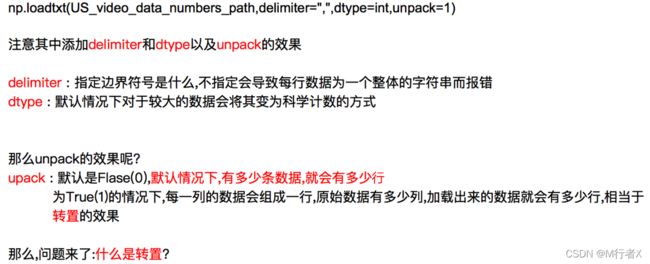

# coding=utf-8
import numpy as np

us_file_path = "./youtube_video_data/US_video_data_numbers.csv"
uk_file_path = "./youtube_video_data/GB_video_data_numbers.csv"

# t1 = np.loadtxt(us_file_path,delimiter=",",dtype="int",unpack=True)
t2 = np.loadtxt(us_file_path,delimiter=",",dtype="int")

# print(t1)
print(t2)

print("*"*100)

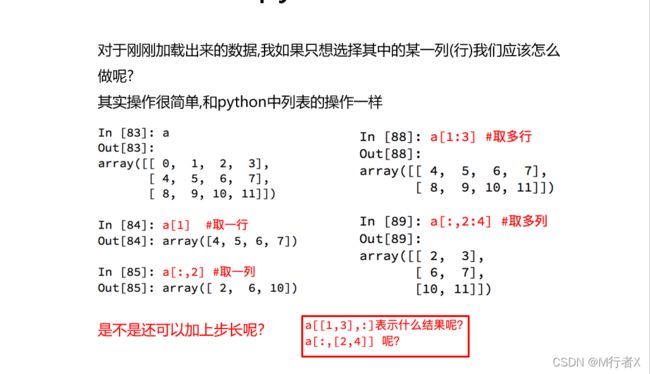
#取行
# print(t2[2])

#取连续的多行
# print(t2[2:])

#取不连续的多行
# print(t2[[2,8,10]])

# print(t2[1,:])
# print(t2[2:,:])
# print(t2[[2,10,3],:])

#取列
# print(t2[:,0])

#取连续的多列
# print(t2[:,2:])

#取不连续的多列
# print(t2[:,[0,2]])

#去行和列,取第3行,第四列的值
# a = t2[2,3]
# print(a)
# print(type(a))

#取多行和多列,取第3行到第五行,第2列到第4列的结果
#去的是行和列交叉点的位置
b = t2[2:5,1:4]
# print(b)

#取多个不相邻的点
#选出来的结果是(0,0) (2,1) (2,3)
c = t2[[0,2,2],[0,1,3]]
print(c)
numpy索引和切片
numpy中布尔索引
numpy中三元运算符
numpy中的clip(裁剪)
numpy中的nan和inf
numpy中的nan的注意点
numpy中常用统计函数
默认返回多维数组的全部的统计结果,如果指定axis则返回一个当前轴上的结果


缺失值处理
# coding=utf-8
import numpy as np


# print(t1)
def fill_ndarray(t1):
    for i in range(t1.shape[1]):  #遍历每一列
        temp_col = t1[:,i]  #当前的一列
        nan_num = np.count_nonzero(temp_col!=temp_col)
        if nan_num !=0: #不为0,说明当前这一列中有nan
            temp_not_nan_col = temp_col[temp_col==temp_col] #当前一列不为nan的array

            # 选中当前为nan的位置,把值赋值为不为nan的均值
            temp_col[np.isnan(temp_col)] = temp_not_nan_col.mean()
    return t1

if __name__ == '__main__':
    t1 = np.arange(24).reshape((4, 6)).astype("float")
    t1[1, 2:] = np.nan
    print(t1)
    t1 = fill_ndarray(t1)
    print(t1)
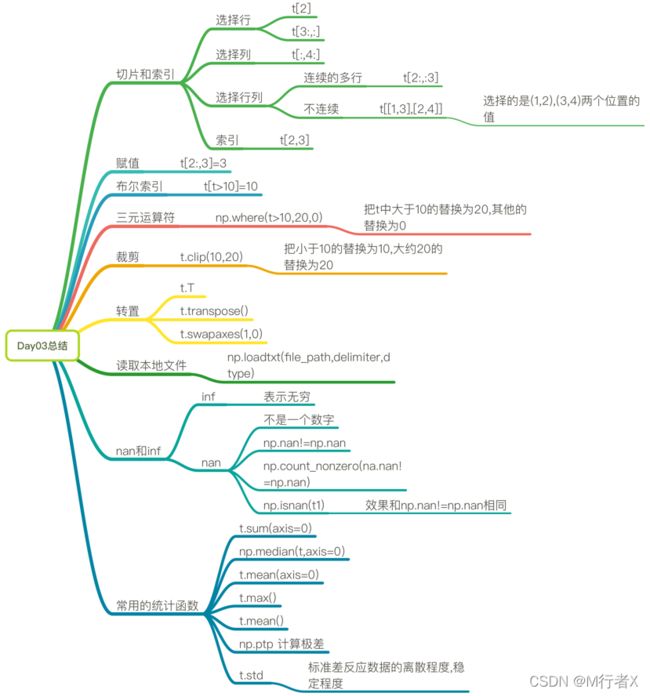
- 如何选择一行或者多行的数据(列)?
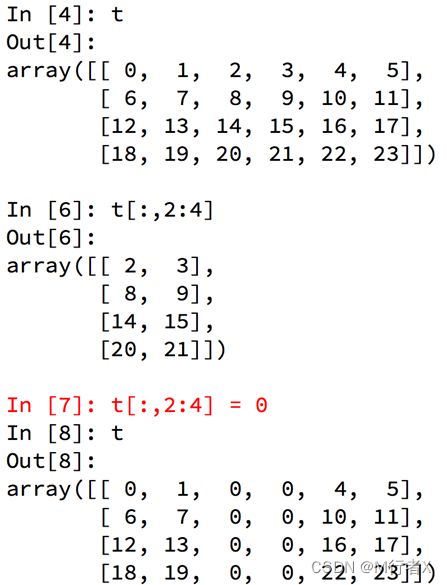
- 如何给选取的行或者列赋值?
- 如何大于把大于10的值替换为10?
- np.where如何使用?
- np.clip如何使用?
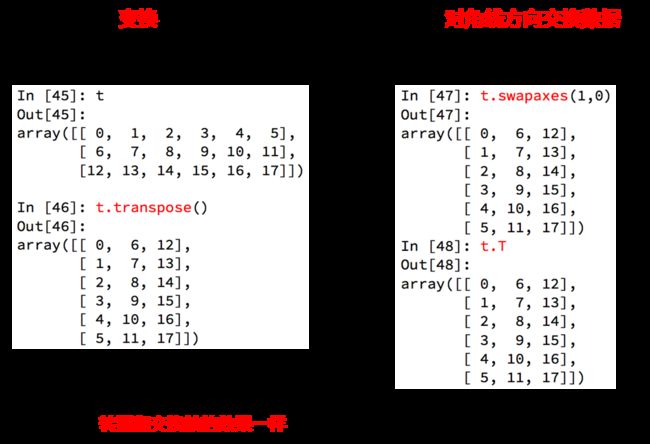
- 如何转置(交换轴)?
- 读取和保存数据为csv
- np.nan和np.inf是什么
- 常用的统计函数你记得几个?
- 标准差反映出数据的什么信息
#### numpy的索引和切片
  - t[10,20]
  - `t[[2,5],[4,8]]`

  - t[3:]
  - t[[2,5,6]]

  - t[:,:4]
  - t[:,[2,5,6]]

  - t[2:3,5:7]


#### numpy中的bool索引,where,clip的使用
  - t[t<30] = 2
  - np.where(t<10,20,5)
  - t.clip(10,20)


#### 转置和读取本地文件
  - t.T
  - t.transpose()
  - t.sawpaxes()

  - np.loadtxt(file_path,delimiter,dtype)


#### nan和inf是什么
  - nan not a number
  - np.nan != np.nan
  - 任何值和nan进行计算都是nan

  - inf 无穷

#### 常用统计函数
  - t.sum()
  - t.mean()
  - np.meadian()
  - t.max()
  - t.min()
  - np.ptp()
  - t.std()
import numpy as np
from matplotlib import  pyplot as plt

us_file_path = "./youtube_video_data/US_video_data_numbers.csv"
uk_file_path = "./youtube_video_data/GB_video_data_numbers.csv"

# t1 = np.loadtxt(us_file_path,delimiter=",",dtype="int",unpack=True)
t_us = np.loadtxt(us_file_path,delimiter=",",dtype="int")

#取评论的数据
t_us_comments = t_us[:,-1]

#选择比5000小的数据
t_us_comments = t_us_comments[t_us_comments<=5000]

print(t_us_comments.max(),t_us_comments.min())

d = 50

bin_nums = (t_us_comments.max()-t_us_comments.min())//d

#绘图
plt.figure(figsize=(20,8),dpi=80)

plt.hist(t_us_comments,bin_nums)


plt.show()
import numpy as np
from matplotlib import  pyplot as plt

us_file_path = "./youtube_video_data/US_video_data_numbers.csv"
uk_file_path = "./youtube_video_data/GB_video_data_numbers.csv"

# t1 = np.loadtxt(us_file_path,delimiter=",",dtype="int",unpack=True)
t_uk = np.loadtxt(uk_file_path,delimiter=",",dtype="int")

#选择喜欢书比50万小的数据
t_uk = t_uk[t_uk[:,1]<=500000]

t_uk_comment = t_uk[:,-1]
t_uk_like = t_uk[:,1]


plt.figure(figsize=(20,8),dpi=80)
plt.scatter(t_uk_like,t_uk_comment)

plt.show()
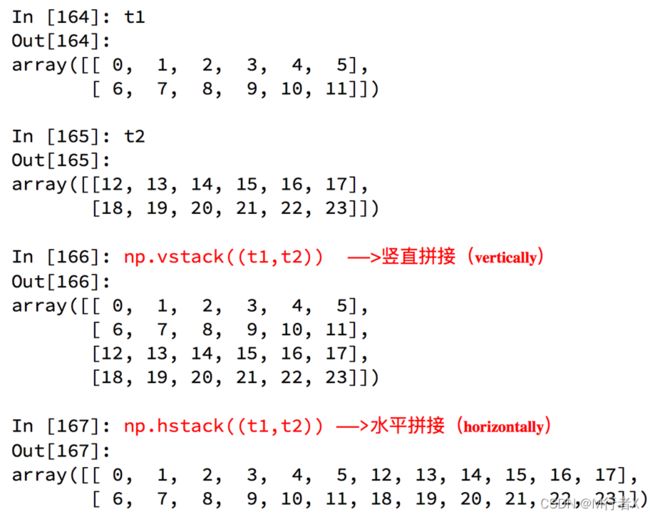
数据拼接
数据行列交换
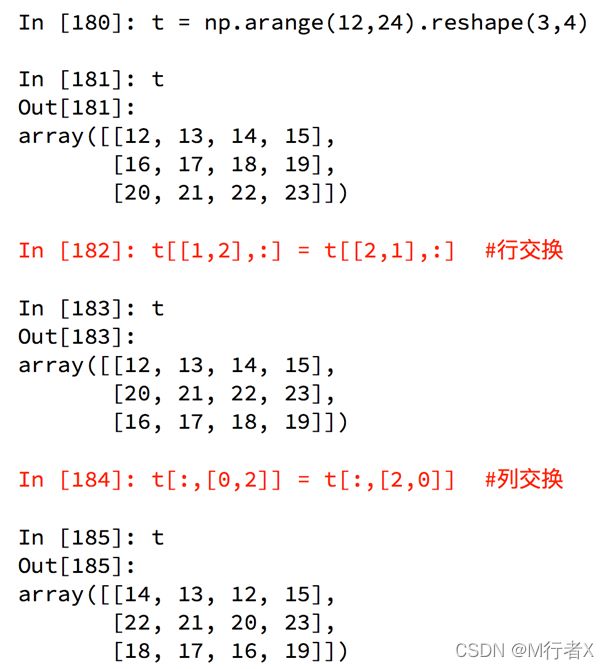
现在我希望把之前案例中两个国家的数据方法一起来研究分析,那么应该怎么做?
# coding=utf-8
import numpy as np

us_data = "./youtube_video_data/US_video_data_numbers.csv"
uk_data = "./youtube_video_data/GB_video_data_numbers.csv"

#加载国家数据
us_data = np.loadtxt(us_data,delimiter=",",dtype=int)
uk_data = np.loadtxt(uk_data,delimiter=",",dtype=int)

# 添加国家信息
#构造全为0的数据
zeros_data = np.zeros((us_data.shape[0],1)).astype(int)
ones_data = np.ones((uk_data.shape[0],1)).astype(int)

#分别添加一列全为0,1的数组
us_data = np.hstack((us_data,zeros_data))
uk_data = np.hstack((uk_data,ones_data))


# 拼接两组数据
final_data = np.vstack((us_data,uk_data))
print(final_data)
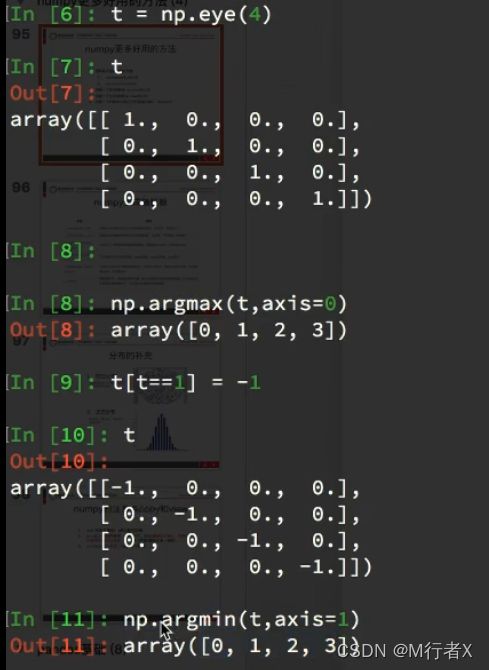
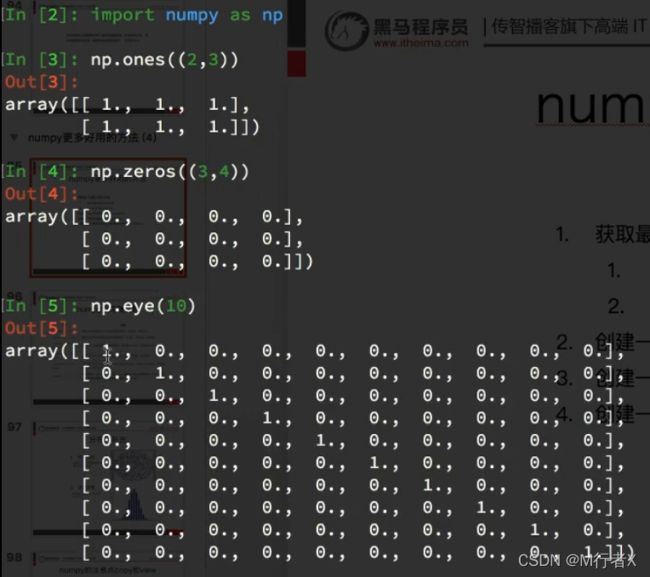
更多好用方法
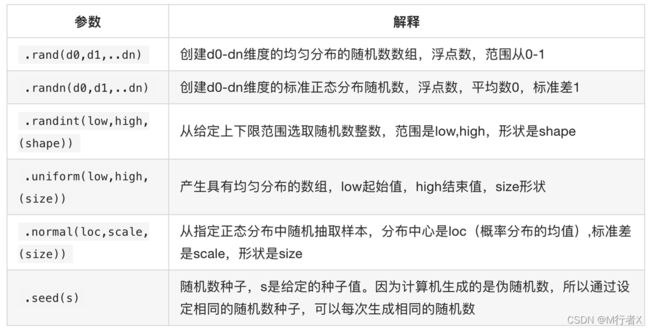
numpy生成随机数
# coding=utf-8
import numpy as np


np.random.seed(10)
t = np.random.randint(0,20,(3,4))
print(t)
