线性回归预测波士顿房价
文章目录
-
-
-
- 代码实操
-
- 简单线性回归公式推导
- 普通实现
- 自制封装类测试
- python封装库
-
-
代码实操
简单线性回归公式推导

普通实现
import numpy as np
import matplotlib.pyplot as plt
#描点
x = np.array([1., 2., 3., 4., 5.])
y = np.array([1., 3., 2., 3., 5.])
plt.scatter(x, y)
plt.axis([0, 6, 0, 6])
plt.show()

#利用公式计算a,b,找出拟合直线
a = (np.mean(x*y) - np.mean(x)*np.mean(y))/(np.mean(x**2) - np.mean(x)**2)
print(a)
b = np.mean(y)-a*np.mean(x)
print(b)
plt.scatter(x,y)
plt.plot(x, a*x+b, color="r")
plt.axis([0,6,0,6])
plt.show()

#预测新数据
x_predict = 6
y_predict = a * x_predict + b
print(y_predict)
自制封装类测试
class SimpleLineRegression:
    #初始化参数a,b
    def __init__(self):
        self.a_ = None
        self.b_ = None
    #根据训练集数据集x_train和y_train训练简单线性回归模型
    def fit(self, x_train, y_train):
        assert x_train.ndim == 1,"简单线性回归只能处理一个样本特征数据,所以x_train必须是一维向量"
        assert len(x_train) == len(y_train),"x_train和y_train的数量必须要对应"
        self.a_ = (np.mean(x_train) * np.mean(y_train) - np.mean(x_train * y_train)) / (np.mean(x_train) ** 2 - np.mean(x_train ** 2))
        self.b_ = np.mean(y_train) - self.a_ * np.mean(x_train)
        return self
    #给定待预测数据集x_predict,返回预测输出
    def predict(self, x_predict):
        assert x_predict.ndim == 1, "因为是简单线性回归,所以待预测数据集必须是一维向量"
        assert self.a_ is not None and self.b_ is not None, "必须先执行fit方法计算a和b"
        return np.array([self._predict(x) for x in x_predict])
    #给定单个预测数据x_single,返回x_single结果
    def predict(self, x_single):
        return self.a_ * x_single + self.b_
# 波士顿房价数据
import numpy as np
import pandas as pd
import matplotlib.pyplot as plt
import matplotlib.pyplot as plt1
from sklearn.metrics import mean_squared_error
from sklearn.model_selection import train_test_split
from SimpleLinearRegression import SimpleLinearRegression
from sklearn import datasets
# ① 测试SimplelinearRegression功能
"""
x = np.array([1., 2., 3., 4., 5.])
y = np.array([1., 3., 2., 3., 5.])
x_predict = 6
slr = SimpleLinearRegression()
slr.fit(x,y)
slr.predict(np.array([x_predict]))
print(slr.a_)
print(slr.b_)
"""
----------------------------------------------
# ② 了解数据特征,熟悉数据分布
"""
boston = datasets.load_boston()
#数据集的特征数目
print(boston.feature_names)
# 数据集维度(506,13)
print(boston.data.shape)
#表格样式输出前10行数据:DataFrame
show_boston = pd.DataFrame(boston.data)
print(show_boston.head(10))
# 散点图
"""
------------------------------------------------
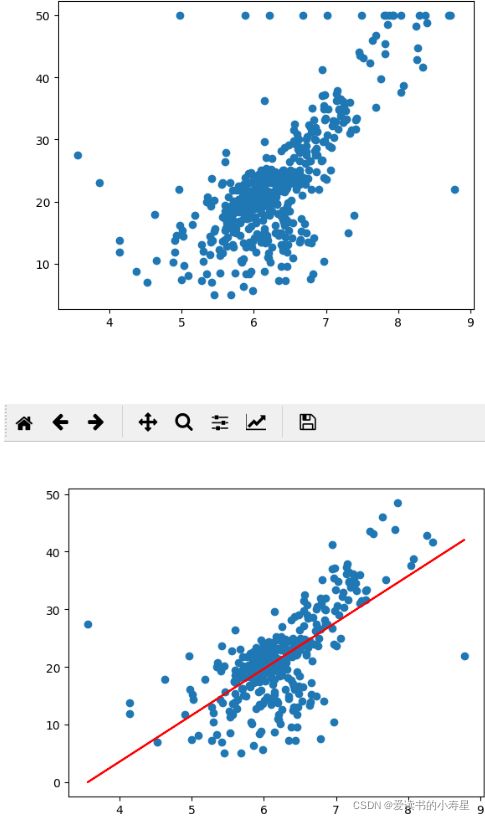
# ③ 预测评估
# 波士顿房价数据提供了13个特征数据,因为是简单线性回归
# 所以我们只使用房间数量RM这个特征来预测房价
#数据集加载
boston = datasets.load_boston()
# 特征数组——取房间数量
feature = boston['data'][:,5]
# 标签数组
target = boston['target']
#绘制散点图
plt.scatter(feature, target)
plt.show()
#线性回归模型拟合一次函数
from SimpleLinearRegression import SimpleLinearRegression
# 删除部分噪声点
feature = feature[target < 50]
target = target[target < 50]
# 先特征值(先训练集,再测试集),再目标值(先训练集,再测试集); test_size测试集占比; random_state若为seed=数值,每次样本数据不变
x_train, x_test, y_train, y_test = train_test_split(feature,target,test_size=0.3,random_state = None)
# 建立模型
slr = SimpleLinearRegression()
# 模型训练
slr.fit(x_train, y_train)
# 模型预测
y_predict = slr.predict(x_train)
from sklearn.linear_model import SGDRegressor
#拟合直线
plt1.scatter(x_train, y_train)
plt1.plot(x_train,y_predict, color="r")
plt1.show()
用于显示图像
def show_res(y_text,y_predict):
    '''
    结果展示
    :param y_text: 测试集目标值真实值
    :param y_predict: 预测值
    :return:
    '''
    # 画布
    pyplot.figure()
    # 默认不支持中文,需要配置RC 参数
    pyplot.rcParams['font.sans-serif'] = 'SimHei'
    # 设置字体之后不支持负号,需要去设置RC参数更改编码
    pyplot.rcParams['axes.unicode_minus'] = False
    # 绘图
    # 折线图
    x = numpy.arange(0,len(y_predict))
    pyplot.plot(x,y_text,marker='*')
    pyplot.plot(x,y_predict,marker='.' )
    # 增加标题
    pyplot.title('房价预测与真实值的走势')
    # 增加横轴,纵轴名称
    pyplot.xlabel('x')
    pyplot.ylabel('房价')
    # 图例
    pyplot.legend(['真实值','预测值'])
    # 展示
    pyplot.show()
python封装库
波士顿房价回归–正规方程
- 正规方程进行求解的线性回归—特征不是特别多,数据不是特别复杂的情况LinearRegression()
- 获取权重和偏执 weight = lr.coef_
bias = lr.intercept_ - 目标值不需要标准化–特征值需要标准化
stand = StandardScaler()
# 加载数据
data = datasets.load_boston()
# 获取特征值
feature = data['data']  # 特征值
target = data['target'] # 目标值
feature_names = data['feature_names']  # 特征值的列名
print(feature_names)
print('*'*40)

# 拆分数据集  -- 拆分成训练集与测试集,特征值与目标值
# feature,target,test_size=0.3 特征值 、目标值、测试集占比
# 返回值---先特征值(先训练集,再测试集),再目标值(先训练集,再测试集)
x_train, x_test, y_train, y_test = train_test_split(feature,target,test_size=0.3)

# 进行标准化---目标值是具体的房价,特征值是各个特征,--量级减小--W量级变大
# 目标值不需要标准化--特征值需要标准化
stand = StandardScaler()
# 先计算均值与标准差,再进行转化
x_train  = stand.fit_transform(x_train)
x_test  = stand.fit_transform(x_test)

# # 正规方程进行求解的线性回归---特征不是特别多,数据不是特别复杂的情况
# 进行构建模型---线性模型
lr = LinearRegression()
# 训练数据
lr.fit(x_train,y_train)
# 预测数据
y_predict = lr.predict(x_test)
# 计算准确率
score = lr.score(x_test,y_test)
# 获取权重和偏执
weight = lr.coef_
bias = lr.intercept_
# 绘图展示
show_res(y_test,y_predict)