【点云鸟瞰图BEV】点云鸟瞰图BEV原理与可视化
本节将介绍激光雷达等点云的鸟瞰图生成原理、代码及效果图。
1 BEV视图原理
点云BEV(Bird's Eye View)视图是指点云在垂直于高度方向的平面上的投影。通常,在获得bev视图前,会将空间分割成体素,利用体素对点云进行下采样,然后将每个体素作为一个点进行投影。体素是指将三维空间按照固定尺寸长方体进行划分时的长方体(Δl*Δw*Δh)。
体素投影时可以得到BEV视图的像素点坐标。每个像素点的特征取值则可以通过多种方式得到。
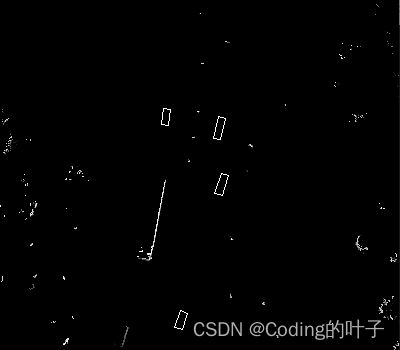
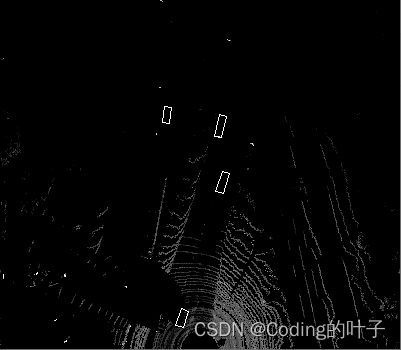
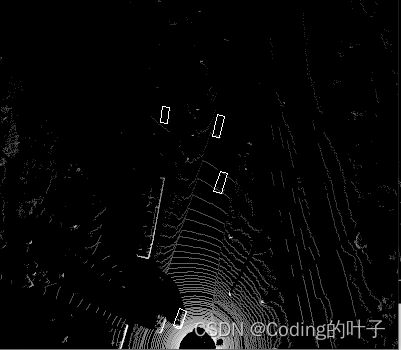
第一种方式是通过统计的方法来得到,称为hand-crafted feature,包括最大高度值、与最大高度值对应的点的强度值、长方体中点云点数、平均强度值等。下文实例程序将统计最大高度值、与最大高度值对应的点的强度值、长方体中点云点数等信息。
另一种方式是通过模型提取每个体素的特征,如voxelnet。Voxelnet通过VFW层实现了体素特征的提取,详细介绍请参考:三维点云目标检测 — VoxelNet模型详解 (三)_Coding的叶子的博客-CSDN博客。
2 可视化代码
点云数据来源于Mini Kitti,数据介绍与下载请参考:KITTI数据集简介 — Mini KITTI_Coding的叶子的博客-CSDN博客。
下列代码中bev[:, :, 0]表示体素中最高点的高度值;bev[:, :, 1]表示体素中最高点的强度;bev[:, :, 2]表示体素中点的密度即点的数量。
关键函数为:lidar_to_bev和draw_polygons。点云真实目标框提取部分请参考:kitti三维目标标注可视化_Coding的叶子的博客-CSDN博客。
# -*- coding: utf-8 -*-
"""
乐乐感知学堂公众号
@author: https://blog.csdn.net/suiyingy
"""
from __future__ import division
import os
import numpy as np
import cv2
import math

 # voxel size
vd = 0.4
vh = 0.2
vw = 0.2

# points cloud range
xrange = (0, 70.4)
yrange = (-40, 40)
zrange = (-3, 1)

# voxel grid
W = math.ceil((xrange[1] - xrange[0]) / vw)
H = math.ceil((yrange[1] - yrange[0]) / vh)
D = math.ceil((zrange[1] - zrange[0]) / vd)

def _quantize_coords(x, y):
    xx = H - int((y - yrange[0]) / vh)
    yy = W - int((x - xrange[0]) / vw)
    return xx, yy

#过滤指定范围之外的点和目标框
def get_filtered_lidar(lidar, boxes3d=None):
    xrange = (0, 70.4)
    yrange = (-40, 40)
    zrange = (-3, 1)
    pxs = lidar[:, 0]
    pys = lidar[:, 1]
    pzs = lidar[:, 2]
    filter_x = np.where((pxs >= xrange[0]) & (pxs < xrange[1]))[0]
    filter_y = np.where((pys >= yrange[0]) & (pys < yrange[1]))[0]
    filter_z = np.where((pzs >= zrange[0]) & (pzs < zrange[1]))[0]
    filter_xy = np.intersect1d(filter_x, filter_y)
    filter_xyz = np.intersect1d(filter_xy, filter_z)
    if boxes3d is not None:
        box_x = (boxes3d[:, :, 0] >= xrange[0]) & (boxes3d[:, :, 0] < xrange[1])
        box_y = (boxes3d[:, :, 1] >= yrange[0]) & (boxes3d[:, :, 1] < yrange[1])
        box_z = (boxes3d[:, :, 2] >= zrange[0]) & (boxes3d[:, :, 2] < zrange[1])
        box_xyz = np.sum(box_x & box_y & box_z,axis=1)
        return lidar[filter_xyz], boxes3d[box_xyz>0]
    return lidar[filter_xyz]

def lidar_to_bev(lidar):
    pxs = lidar[:, 0]
    pys = lidar[:, 1]
    pzs = lidar[:, 2]
    prs = lidar[:, 3]

    qxs=((pxs-xrange[0])/vw).astype(np.int32)
    qys=((pys-yrange[0])/vh).astype(np.int32)
    qzs=((pzs-zrange[0])/vd).astype(np.int32)

    print('height,width,channel=%d,%d,%d'%(W, H, D))
    top = np.zeros(shape=(W, H, D), dtype=np.float32)
    mask = np.ones(shape=(W, H, D), dtype=np.float32)* -5
    bev = np.zeros(shape=(W, H, 3), dtype=np.float32)
    bev[:, : ,0] = np.ones(shape=(W, H), dtype=np.float32)* -5

    for i in range(len(pxs)):
        #统计高度方向上每个体素的个数
        bev[-qxs[i], -qys[i], -1]= 1+ bev[-qxs[i], -qys[i], -1]
        if pzs[i]>mask[-qxs[i], -qys[i],qzs[i]]:
            #记录每个体素中点的最大高度值
            top[-qxs[i], -qys[i], qzs[i]] = max(0,pzs[i]-zrange[0])
            #更新最大高度值
            mask[-qxs[i], -qys[i],qzs[i]]=pzs[i]
        if pzs[i]>bev[-qxs[i], -qys[i], 0]:
            #记录高度方向上的最大高度值
            bev[-qxs[i], -qys[i], 0]=pzs[i]
            #记录高度方向上最高点的强度值
            bev[-qxs[i], -qys[i], 1]=prs[i]

    bev[:,:,-1] = np.log(bev[:,:,-1]+1)/math.log(64)


    bev_image = bev - np.min(bev.reshape(-1, 3), 0)
    bev_image_image = (bev_image/np.max(bev_image.reshape(-1, 3), 0)*255).astype(np.uint8)
    return  bev[:, :, 0], bev[:, :, 1], bev[:, :, 2]

def  draw_polygons(image, polygons,color=(255,255,255), thickness=1, darken=1):
    img = image.copy() * darken
    for polygon in polygons:
        tup0, tup1, tup2, tup3 = [_quantize_coords(*tup) for tup in polygon]
        cv2.line(img, tup0, tup1, color, thickness, cv2.LINE_AA)
        cv2.line(img, tup1, tup2, color, thickness, cv2.LINE_AA)
        cv2.line(img, tup2, tup3, color, thickness, cv2.LINE_AA)
        cv2.line(img, tup3, tup0, color, thickness, cv2.LINE_AA)
    return img

def load_kitti_calib(calib_file):
    """
    load projection matrix
    """
    with open(calib_file) as fi:
        lines = fi.readlines()
        assert (len(lines) == 8)
    obj = lines[0].strip().split(' ')[1:]
    P0 = np.array(obj, dtype=np.float32)
    obj = lines[1].strip().split(' ')[1:]
    P1 = np.array(obj, dtype=np.float32)
    obj = lines[2].strip().split(' ')[1:]
    P2 = np.array(obj, dtype=np.float32)
    obj = lines[3].strip().split(' ')[1:]
    P3 = np.array(obj, dtype=np.float32)
    obj = lines[4].strip().split(' ')[1:]
    R0 = np.array(obj, dtype=np.float32)
    obj = lines[5].strip().split(' ')[1:]
    Tr_velo_to_cam = np.array(obj, dtype=np.float32)
    obj = lines[6].strip().split(' ')[1:]
    Tr_imu_to_velo = np.array(obj, dtype=np.float32)
    return {'P2': P2.reshape(3, 4),
            'R0': R0.reshape(3, 3),
            'Tr_velo2cam': Tr_velo_to_cam.reshape(3, 4)}


def box3d_cam_to_velo(box3d, Tr):
    def project_cam2velo(cam, Tr):
        T = np.zeros([4, 4], dtype=np.float32)
        T[:3, :] = Tr
        T[3, 3] = 1
        T_inv = np.linalg.inv(T)
        lidar_loc_ = np.dot(T_inv, cam)
        lidar_loc = lidar_loc_[:3]
        return lidar_loc.reshape(1, 3)

    def ry_to_rz(ry):
        angle = -ry - np.pi / 2
        if angle >= np.pi:
            angle -= np.pi
        if angle < -np.pi:
            angle = 2*np.pi + angle
        return angle

    h,w,l,tx,ty,tz,ry = [float(i) for i in box3d]
    cam = np.ones([4, 1])
    cam[0] = tx
    cam[1] = ty
    cam[2] = tz
    t_lidar = project_cam2velo(cam, Tr)
    Box = np.array([[-l / 2, -l / 2, l / 2, l / 2, -l / 2, -l / 2, l / 2, l / 2],
                    [w / 2, -w / 2, -w / 2, w / 2, w / 2, -w / 2, -w / 2, w / 2],
                    [0, 0, 0, 0, h, h, h, h]])
    rz = ry_to_rz(ry)
    rotMat = np.array([
        [np.cos(rz), -np.sin(rz), 0.0],
        [np.sin(rz), np.cos(rz), 0.0],
        [0.0, 0.0, 1.0]])
    velo_box = np.dot(rotMat, Box)
    cornerPosInVelo = velo_box + np.tile(t_lidar, (8, 1)).T
    box3d_corner = cornerPosInVelo.transpose()
    return box3d_corner.astype(np.float32)

def load_kitti_label(label_file, Tr):
    with open(label_file,'r') as f:
        lines = f.readlines()
    gt_boxes3d_corner = []
    num_obj = len(lines)
    for j in range(num_obj):
        obj = lines[j].strip().split(' ')
        obj_class = obj[0].strip()
        if obj_class not in ['Car']:
            continue
        box3d_corner = box3d_cam_to_velo(obj[8:], Tr)
        gt_boxes3d_corner.append(box3d_corner)
    gt_boxes3d_corner = np.array(gt_boxes3d_corner).reshape(-1,8,3)
    return gt_boxes3d_corner

def test():
    lidar_path = os.path.join('./data/KITTI/training', "velodyne/")
    calib_path = os.path.join('./data/KITTI/training', "calib/")
    label_path = os.path.join('./data/KITTI/training', "label_2/")
    lidar_file = lidar_path + '/' + '000016' + '.bin'
    calib_file = calib_path + '/' + '000016' + '.txt'
    label_file = label_path + '/' + '000016' + '.txt'

    #加载雷达数据
    print("Processing: ", lidar_file)
    lidar = np.fromfile(lidar_file, dtype=np.float32)
    lidar = lidar.reshape((-1, 4))

    #加载标注文件
    calib = load_kitti_calib(calib_file)
    #标注转三维目标检测框
    gt_box3d = load_kitti_label(label_file, calib['Tr_velo2cam'])

    #过滤指定范围之外的点和目标框
    lidar, gt_box3d = get_filtered_lidar(lidar, gt_box3d)

    hight_image, height_r_image, density_image = lidar_to_bev(lidar)
    hight_with_box = draw_polygons(hight_image,gt_box3d[:,:4,:2])
    height_r_with_box = draw_polygons(height_r_image,gt_box3d[:,:4,:2])
    density_with_box = draw_polygons(density_image,gt_box3d[:,:4,:2])
    cv2.imshow('hight', hight_with_box)
    cv2.imshow('height_r', height_r_with_box)
    cv2.imshow('density', density_with_box)
    cv2.imwrite('hight.png', hight_with_box)
    cv2.imwrite('height_r.png', height_r_with_box)
    cv2.imwrite('density.png', density_with_box)
    cv2.waitKey(0)

if __name__ == '__main__':
    test()
3 可视化效果
4 python三维点云从基础到深度学习_Coding的叶子的博客-CSDN博客_python三维点云重建
更多三维、二维感知算法和金融量化分析算法请关注“乐乐感知学堂”微信公众号,并将持续进行更新。


