机器学习扫盲系列1
一、交叉熵损失(Cross entropy loss)
二分类问题中常见,其是用于判断模型在样本上的表现
1、why Cross entropy loss?
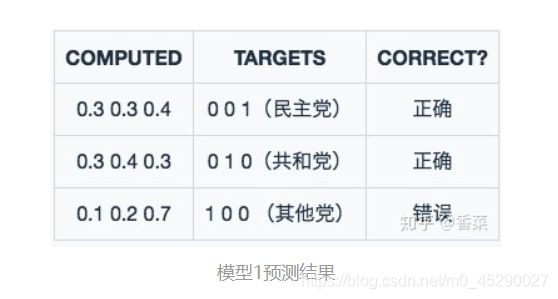
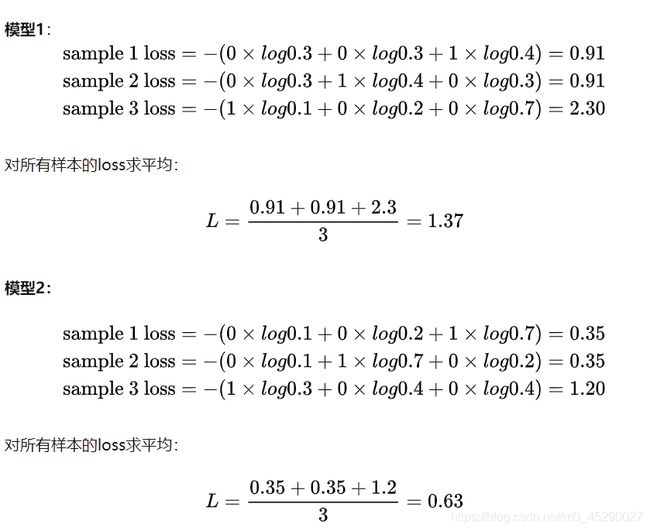
example:希望根据一个人的年龄、性别、年收入等相互独立的特征,来预测一个人的政治倾向,有三种可预测结果:民主党、共和党、其他党。假设我们当前有两个逻辑回归模型(参数不同),这两个模型都是通过sigmoid的方式得到对于每个预测结果的概率值:
模型一:
模型二
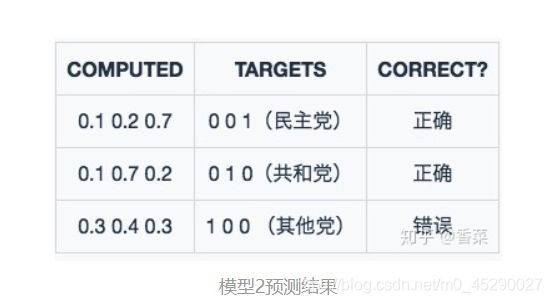
分析:虽然两个模型的预测结果都是正确两个,错误一个,但就评分而言,模型二的结果要优于模型一
1)
Classification Error(分类错误率)
最为直接的损失函数定义为:

用此方法对于两个模型的评分均为1/3,并没有很好的区分模型一二的优劣。
2)Mean Squared Error (均方误差)

按此方法,模型一的评分为0.81;模型二的评分为0.34。MSE能够判断出来模型2优于模型1,那为什么不采样这种损失函数呢?主要原因是逻辑回归配合MSE损失函数时,采用梯度下降法进行学习时,会出现模型一开始训练时,学习速率非常慢的情况(因为其偏导值在输出概率值接近0或者接近1的时候非常小,这可能会造成模型刚开始训练时,偏导值几乎消失。新权值=当前权值-学习率*梯度,即 学习速率控制了我们在多大程度上调整了我们的网络的权重,并对损失梯度进行了调整)损失函数的值与梯度的关系:梯度:损失函数对于某一属性值求导。
3)交叉熵(Cross entropy loss)
公式
二分类情况
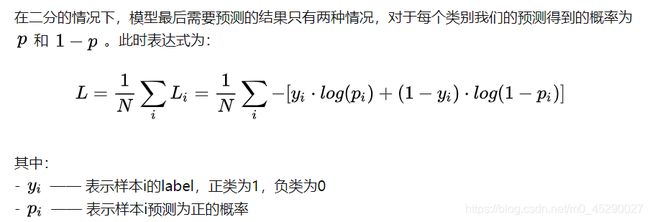
多分类情况
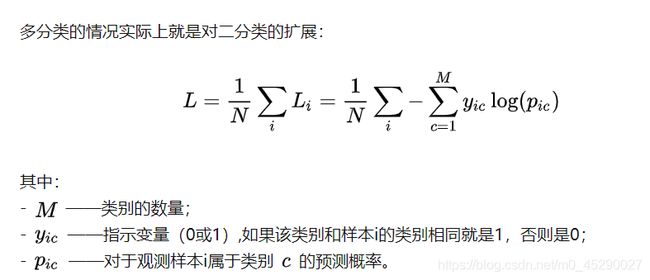
对上述模型的计算结果
函数性质

该函数是凸函数,求导时能够得到全局最优值
学习过程
交叉熵损失函数经常用于分类问题中,特别是在神经网络做分类问题时,也经常使用交叉熵作为损失函数。因为交叉熵涉及到计算每个类别的概率,所以交叉熵几乎每次都和sigmoid(或softmax)一起出现。
利用神经网络最后一层输出情况了解整个模型预测、获得损失和学习的流程。
1)神经网络最后一层得到每个类别的得分scores;
2)该得分经过sigmoid(或softmax)函数获得概率输出;
3)模型预测的类别概率输出与真实类别的one_hot形式进行交叉熵损失函数的计算
由交叉熵损失函数得到的梯度为:
![]()
在用梯度下降法做参数更新的时候,模型学习的速度取决于两个值:一、学习率;二、偏导值。其中,学习率是我们需要设置的超参数,所以只用重点关注偏导值。从上面的式子中,可以发现,偏导值的大小取决于两个乘积。关注前面的中括号,该值越大,说明模型效果越差,但是该值越大同时也会使得偏导值越大,从而模型学习速度更快。所以,使用逻辑函数得到概率,并结合交叉熵当损失函数时,在模型效果差的时候学习速度比较快,在模型效果好的时候学习速度变慢。
二、Sigmoid函数
函数图像:
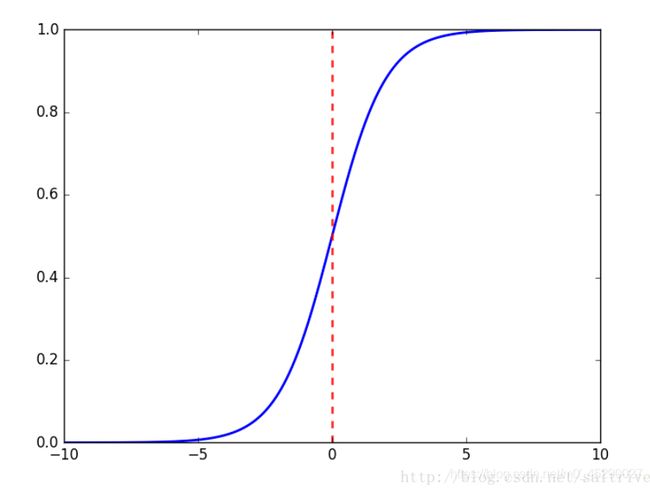
可以看出,sigmoid函数连续,光滑,严格单调,以(0,0.5)中心对称,是一个非常良好的阈值函数。
当x趋近负无穷时,y趋近于0;趋近于正无穷时,y趋近于1;x=0时,y=0.5。当然,在x超出[-6,6]的范围后,函数值基本上没有变化,值非常接近,在应用中一般不考虑。
Sigmoid函数的值域范围限制在(0,1)之间,我们知道[0,1]与概率值的范围是相对应的,这样sigmoid函数就能与一个概率分布联系起来了。
三、流形
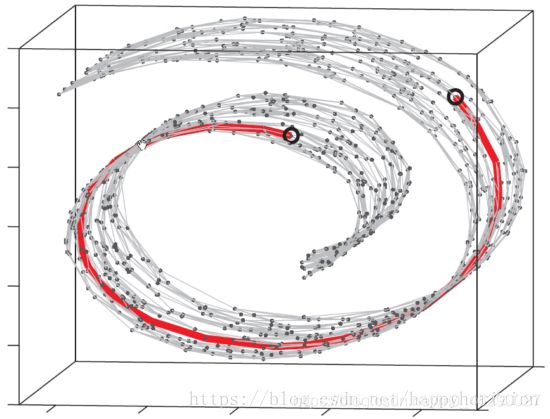
如何计算蛋糕卷起表面上两点距离,就是流行计算中要解决的一个问题
流形,是局部具有欧几里得空间性质的空间,是欧几里得空间中的曲线、曲面等概念的推广。欧几里得空间就是最简单的流形的实例。地球表面这样的球面则是一个稍微复杂的例子。一般的流形可以通过把许多平直的片折弯并粘连而成(欧几里得空间就是在对现实空间的规则抽象和推广(从n<=3推广到有限n维空间))
四、注意力模块
Attention-model是在编码-解码模型的基础上改进而来,编码-解码模型有一个明显的短板,即语义编码C是固定长度的。如果前面的序列比较长,那么语义编码C中包含的信息大部分都是关于序列后段的,前段的信息很可能已经被替换掉或者覆盖掉。因此序列越长这个问题就会越明显。
为了克服普通的Encoder-Decoder结构的缺陷,一种新的模型被提出。其主要思想是选择编码过程中重要的部分来作为编码的输入。根据量化的思想,主要做法就是对编码阶段的每个输出增加一个权重(用softmax获得),而且这个权重是根据编码过程中的隐含状态计算得到的,这样每一个序列都有一个不同的语义编码,由此决定序列中每一个部分的重要性。这样就可以很好的避免普通Encoder-Decoder模型的短板。
五、极大似然函数
就是利用已知的样本结果信息,反推最具有可能(最大概率)导致这些样本结果出现的模型参数值!
六、凹凸函数
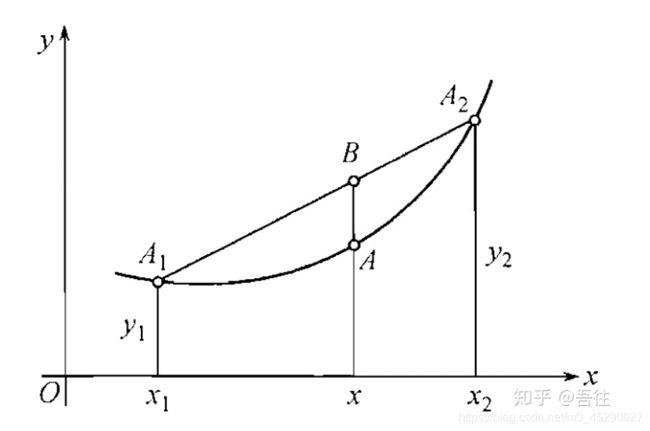
若函数f(x)为凸函数,那么-f(x)为凹函数
凸函数图形表示:
七、one-hot向量
解决的问题:在机器学习算法中,我们经常会遇到分类特征,例如:人的性别有男女,祖国有中国,美国,法国等。 这些特征值并不是连续的,而是离散的,无序的。
定义:独热编码即 One-Hot 编码,又称一位有效编码。其方法是使用 N位 状态寄存器来对 N个状态 进行编码,每个状态都有它独立的寄存器位,并且在任意时候,其中只有一位有效。
例子:
举例2:
按照 N位状态寄存器 来 对N个状态 进行编码的原理,处理后应该是这样的
性别特征:[“男”,“女”] (这里只有两个特征,所以 N=2):
男 => 10
女 => 01
祖国特征:[“中国”,"美国,“法国”](N=3):
中国 => 100
美国 => 010
法国 => 001
运动特征:[“足球”,“篮球”,“羽毛球”,“乒乓球”](N=4):
足球 => 1000
篮球 => 0100
羽毛球 => 0010
乒乓球 => 0001
所以,当一个样本为 [“男”,“中国”,“乒乓球”] 的时候,完整的特征数字化的结果为:
[1,0,1,0,0,0,0,0,1]
八、逻辑回归
对逻辑回归的理解:
1、作用:用于估计某种事物的可能性,用于回归或者二分类
2、LogisticRegression 就是一个被logistic方程归一化后的线性回归
3、优化求解采用梯度下降的方法,即采用此方法来改变权重
下面为代码示例
#logRegression.py
#################################################
# logRegression: Logistic Regression
# Author : zouxy
# Date   : 2014-03-02
# HomePage : http://blog.csdn.net/zouxy09
# Email  : [email protected]
#################################################

from numpy import *
import matplotlib.pyplot as plt
import time


# calculate the sigmoid function
def sigmoid(inX):
	return 1.0 / (1 + exp(-inX))


# train a logistic regression model using some optional optimize algorithm
# input: train_x is a mat datatype, each row stands for one sample
#		 train_y is mat datatype too, each row is the corresponding label
#		 opts is optimize option include step and maximum number of iterations
def trainLogRegres(train_x, train_y, opts):
	# calculate training time
	startTime = time.time()

	numSamples, numFeatures = shape(train_x)
	alpha = opts['alpha']; maxIter = opts['maxIter']
	weights = ones((numFeatures, 1))

	# optimize through gradient descent algorilthm
	for k in range(maxIter):
		if opts['optimizeType'] == 'gradDescent': # gradient descent algorilthm
			output = sigmoid(train_x * weights)
			error = train_y - output
			weights = weights + alpha * train_x.transpose() * error
		elif opts['optimizeType'] == 'stocGradDescent': # stochastic gradient descent
			for i in range(numSamples):
				output = sigmoid(train_x[i, :] * weights)
				error = train_y[i, 0] - output
				weights = weights + alpha * train_x[i, :].transpose() * error
		elif opts['optimizeType'] == 'smoothStocGradDescent': # smooth stochastic gradient descent
			# randomly select samples to optimize for reducing cycle fluctuations
			dataIndex = range(numSamples)
			for i in range(numSamples):
				alpha = 4.0 / (1.0 + k + i) + 0.01
				randIndex = int(random.uniform(0, len(dataIndex)))
				output = sigmoid(train_x[randIndex, :] * weights)
				error = train_y[randIndex, 0] - output
				weights = weights + alpha * train_x[randIndex, :].transpose() * error
				del(dataIndex[randIndex]) # during one interation, delete the optimized sample
		else:
			raise NameError('Not support optimize method type!')


	print 'Congratulations, training complete! Took %fs!' % (time.time() - startTime)
	return weights


# test your trained Logistic Regression model given test set
def testLogRegres(weights, test_x, test_y):
	numSamples, numFeatures = shape(test_x)
	matchCount = 0
	for i in xrange(numSamples):
		predict = sigmoid(test_x[i, :] * weights)[0, 0] > 0.5
		if predict == bool(test_y[i, 0]):
			matchCount += 1
	accuracy = float(matchCount) / numSamples
	return accuracy


# show your trained logistic regression model only available with 2-D data
def showLogRegres(weights, train_x, train_y):
	# notice: train_x and train_y is mat datatype
	numSamples, numFeatures = shape(train_x)
	if numFeatures != 3:
		print "Sorry! I can not draw because the dimension of your data is not 2!"
		return 1

	# draw all samples
	for i in xrange(numSamples):
		if int(train_y[i, 0]) == 0:
			plt.plot(train_x[i, 1], train_x[i, 2], 'or')
		elif int(train_y[i, 0]) == 1:
			plt.plot(train_x[i, 1], train_x[i, 2], 'ob')

	# draw the classify line
	min_x = min(train_x[:, 1])[0, 0]
	max_x = max(train_x[:, 1])[0, 0]
	weights = weights.getA()  # convert mat to array
	y_min_x = float(-weights[0] - weights[1] * min_x) / weights[2]
	y_max_x = float(-weights[0] - weights[1] * max_x) / weights[2]
	plt.plot([min_x, max_x], [y_min_x, y_max_x], '-g')
	plt.xlabel('X1'); plt.ylabel('X2')
	plt.show()
测试代码:
#test_logRegression.py
#################################################
# logRegression: Logistic Regression
# Author : zouxy
# Date   : 2014-03-02
# HomePage : http://blog.csdn.net/zouxy09
# Email  : [email protected]
#################################################

from numpy import *
import matplotlib.pyplot as plt
import time

def loadData():
	train_x = []
	train_y = []
	fileIn = open('E:/Python/Machine Learning in Action/testSet.txt')
	for line in fileIn.readlines():
		lineArr = line.strip().split()
		train_x.append([1.0, float(lineArr[0]), float(lineArr[1])])
		train_y.append(float(lineArr[2]))
	return mat(train_x), mat(train_y).transpose()


## step 1: load data
print "step 1: load data..."
train_x, train_y = loadData()
test_x = train_x; test_y = train_y

## step 2: training...
print "step 2: training..."
opts = {'alpha': 0.01, 'maxIter': 20, 'optimizeType': 'smoothStocGradDescent'}
optimalWeights = trainLogRegres(train_x, train_y, opts)

## step 3: testing
print "step 3: testing..."
accuracy = testLogRegres(optimalWeights, test_x, test_y)

## step 4: show the result
print "step 4: show the result..."
print 'The classify accuracy is: %.3f%%' % (accuracy * 100)
showLogRegres(optimalWeights, train_x, train_y)
运行代码遇到的问题及解决方案:
1、
原因:python3.x range返回的是range对象,不返回数组对象。而前者的数据不可更改故
![]()
会出错
解决方法:将
dataIndex = range(numSamples)
改为
dataIndex = list(range(numSamples))
即可解决。
参考:
【1】损失函数 - 交叉熵损失函数
【2】Sigmoid函数
【3】机器学习算法与Python实践之(七)逻辑回归(Logistic Regression)
【4】机器学习数据预处理1:独热编码(One-Hot)
【5】https://blog.csdn.net/randompeople/article/details/83244766
【6】https://blog.csdn.net/u013106893/article/details/84387794
