数字图像处理——彩色图像处理
5.1
f=imread('D:代码:\1\1.tif');
[x1,map1]=rgb2ind(f,8,'nodither');
[x2,map2]=rgb2ind(f,8,'dither');
g=rgb2gray(f);
g1=dither(g);
subplot(3,3,1),imshow('D:\作业\tp\DIP3E_CH06_Original_Images\DIP3E_Original_Images_CH06\1.tif')
subplot(3,3,2),imshow(x2,map1)
subplot(3,3,3),imshow(x2,map2)
subplot(3,3,4),imshow(g)
subplot(3,3,5),imshow(g1)
运行结果:
5.2
代码:
path=('D:\1\2.tif');
%% RGB
I=imread(path);
figure();
subplot(111);
imshow(I);%显示原始彩色图像title('原始图像');
%% HSI颜色空间
iHsi=rgb2hsi(I);
figure();
hsi_H=iHsi(:,:,1); %色调
hsi_S=iHsi(:,:,2); %饱和度
hsi_I=iHsi(:,:,3); %亮度
subplot(131);imshow(hsi_H);title('H(色调)');
subplot(132);imshow(hsi_S);title('S(饱和度)');
subplot(133);imshow(hsi_I);title('I(亮度)');
结果:
5.3
代码:
L = linspace(40,80,1024); %构建线性斜坡
radius = 70;
theta = linspace(0,pi,1024);
a = radius*cos(theta);
b = radius*sin(theta); %设置平面中的彩色极角
L=repmat(L,100,1);
a=repmat(a,100,1);
b=repmat(b,100,1);
lab_scale = cat(3,L,a,b); %制作一幅彩色标尺图像
cform = makecform('lab2srgb');
rgb_scale = applycform(lab_scale,cform);
imshow(rgb_scale) %显示彩色标尺
结果:
5.4
代码:
f=imread('D:\作业\tp\DIP3E_CH06_Original_Images\DIP3E_Original_Images_CH06\4.tif');
fp = padarray(f, [40 40], 255, 'both');
fp = padarray(fp, [4 4], 230, 'both');
p_srgb = iccread('E:\matlab\bin\code\srgb.icm'); %描述sRGB彩色空间的剖面
p_snap = iccread('E:\matlab\bin\code\SNAP2007.icc'); %新闻纸剖面
cform1 = makecform('icc', p_srgb, p_snap);
fp_newsprint = applycform(fp, cform1);
cform2 = makecform('icc', p_snap, p_srgb, 'SourceRenderingIntent', 'AbsoluteColorimetric', 'DestRenderingIntent', 'AbsoluteColorimetric');
fp_proof = applycform(fp_newsprint, cform2); %指定渲染意图
subplot(1, 2, 1), imshow(fp);title('(a)具有白边的原始图像');
subplot(1, 2, 2), imshow(fp_proof);title('(b)当在新闻纸上打印时对图像外观的模拟 ');
结果:
5.5
% 单色
f = imread('coins.png');
g = ice('image', f, 'wait', 'off');
% 单色
f = imread('D:\1\6.tif');
imshow(f)
g = ice('image', f, 'wait', 'off');
结果:
5.6
% 单色
f = imread('D:\1\7.TIF');
imshow(f)
g = ice('image', f, 'wait', 'off');
5.7
f = imread('D:\1\8.tif');
imshow(f)
g = ice('image', f);
5.8
f = imread('D:\1\9.tif');
imshow(f);
g = ice('image', f, 'space', 'CMY');
5.9
f = imread('D:\1\10.tif');
imshow(f);
g = ice('image', f, 'space', 'hsi');
5.10
f = imread('C:\Users\hasee\Desktop\1\1.tif');
r = f(:, :, 1);
g = f(:, :, 2);
b = f(:, :, 3);
hsi = rgb2hsi(f);
subplot(4, 3, 1), imshow(f), title('原图');
subplot(4, 3, 2), imshow(f), title('RGB图');
subplot(4, 3, 3), imshow(hsi), title('HSI图');
h = hsi(:, :, 1);
s = hsi(:, :, 2);
i = hsi(:, :, 3);
w = fspecial('average', 25);
r = imfilter(r, w, 'replicate');
g = imfilter(g, w, 'replicate');
b = imfilter(b, w, 'replicate');
rgb = cat(3, r, g, b);
i = imfilter(i, w, 'replicate');
hsi = cat(3, h, s, i);
subplot(4, 3, 4), imshow(r), title('R通道');
subplot(4, 3, 5), imshow(g), title('G通道');
subplot(4, 3, 6), imshow(b), title('B通道');
subplot(4, 3, 7), imshow(h), title('H通道');
subplot(4, 3, 8), imshow(s), title('S通道');
subplot(4, 3, 9), imshow(i), title('I通道');
subplot(4, 3, 10), imshow(f), title('原图');
subplot(4, 3, 11), imshow(rgb), title('平滑后RGB图');
subplot(4, 3, 12), imshow(hsi2rgb(hsi)), title('平滑后HSI图');
5.11
%彩色图像的锐化处理
clc;
clear all;
close all;
f=imread('D:\1\10.tif'); %加载原图像
imshow(f)
figure;imshow(f);title('原始图像');
fb=tofloat(f); %将图像转化为浮点型
lapmask=[1 1 1;1 -8 1;1 1 1]; %拉普拉斯滤波模板
fen=fb-imfilter(fb,lapmask,'replicate');
figure;imshow(fen);title('增强后');
5.12
f = imread('D:\1\11.tif');
r = f(:, :, 1);
subplot(2, 3, 1), imshow(r), title('r');
g = f(:, :, 2);
subplot(2, 3, 2), imshow(g), title('g');
b = f(:, :, 3);
subplot(2, 3, 3), imshow(b), title('b');
[VG, VA, PPG] = colorgrad(f);
subplot(2, 3, 4), imshow(f), title('RGB');
subplot(2, 3, 5), imshow(VG), title('VG');
subplot(2, 3, 6), imshow(PPG), title('PPG');
f = imread('D:\1\1.tif');
r = f(:, :, 1);
subplot(2, 3, 1), imshow(r), title('r');
g = f(:, :, 2);
subplot(2, 3, 2), imshow(g), title('g');
b = f(:, :, 3);
subplot(2, 3, 3), imshow(b), title('b');
[VG, VA, PPG] = colorgrad(f);
subplot(2, 3, 4), imshow(im2bw(abs(PPG- VG), 0.02)), title('VG - PPG');
subplot(2, 3, 5), imshow(VG), title('VG');
subplot(2, 3, 6), imshow(PPG), title('PPG');
5.13
f = imread('D:\1\12.tif');
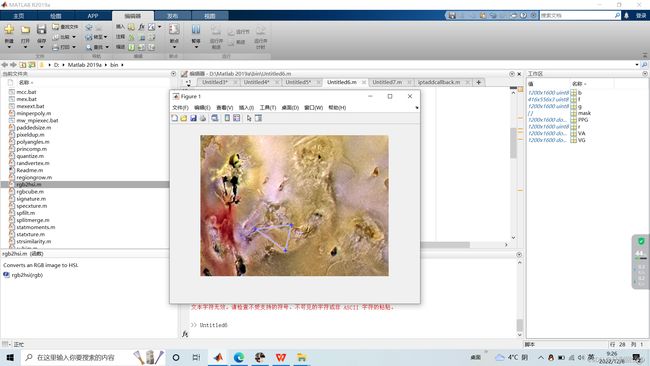
mask = roipoly(f);
red = immultiply(mask, f(:, :, 1));
green= immultiply(mask, f(:, :, 2));
blue= immultiply(mask, f(:, :, 3));
g = cat(3, red, green, blue);
imshow(g);
rgb=imread('D:\1\12.tif');
figure,
subplot(2,2,1);
imshow(rgb)
rgb1=im2double(rgb);
r=rgb1(:,:,1);%图像的红色分量
g=rgb1(:,:,2);%图像的绿色分量
b=rgb1(:,:,3);%图像的蓝色分量
r1=r(130:195,86:170);%在?的红分量中选择一块矩形区域,由输入可知size(r)=(195 ,218),改变选择的行列可以改变标准偏差的标准值
r1_u=mean(mean(r1(:)));%计算该矩形区域的均值
[m,n]=size(r1);%得到该矩形区域的高度和宽度
sd1=0.0;;%该区域标准偏差变量
for i=1:m
for j=1:n
sd1=sd1+(r1(i,j)-r1_u)*(r1(i,j)-r1_u);%二重循环对差值的平均进行累加
end
end
r1_d=sqrt(sd1/(m*n));%计算得到该区域的标准偏差
r2=zeros(size(rgb1,1),size(rgb1,2));
ind=find((r>r1_u-1.10*r1_d)&(r
r2(ind)=1;%将符合条件的点的灰度值赋值为1
subplot(2,2,2);
imshow(r2);
title('标准差为1.10');
ind=find((r>r1_u-1.20*r1_d)&(r
r2(ind)=1;
subplot(2,2,3);
imshow(r2);
title('标准差为1.20');
ind=find((r>r1_u-1.30*r1_d)&(r
r2(ind)=1;
subplot(2,2,4);
imshow(r2);
title('标准差为1.30');
以上实验均在Matlab中实现,对图像进行彩色处理。


