voc数据集分析
import xml.etree.ElementTree as ET
import pickle
import os
from os import listdir, getcwd
from os.path import join
import cv2
import matplotlib.pyplot as plt
from math import sqrt as sqrt

# 需要检查的数据
sets = [('2012', 'person_trainval')]
# 需要检查的类别
classes = ['person']
# 输入分辨率
input_size = 320

if __name__ == '__main__':
    VOCRoot = 'G:/bili\pytorch_object_detection/faster_rcnn\VOCdevkit/'
    # GT框宽高统计
    width = []
    height = []

    for year, image_set in sets:
        for line in open(VOCRoot + '/VOC%s/ImageSets/Main/%s.txt' % (year, image_set)):
            image_id, value = line.split()
            if value != '1':
                continue
            # 图片的路径
            img_path = VOCRoot +'/VOC%s/JPEGImages/%s.jpg' % (year, image_id)
            # 这张图片的XML标注路径
            label_file = open(VOCRoot +'VOC%s/Annotations/%s.xml' % (year, image_id))
            tree = ET.parse(label_file)
            root = tree.getroot()
            size = root.find('size')
            img_w = int(size.find('width').text)  # 原始图片的width
            img_h = int(size.find('height').text)  # 原始图片的height
            img = cv2.imread(img_path)
            for obj in root.iter('object'):
                difficult = obj.find('difficult').text
                cls = obj.find('name').text
                # 如果标注不是需要的类别或者标注为difficult,就忽略
                if cls not in classes or int(difficult) == 1:
                    continue
                cls_id = classes.index(cls)

                xmlbox = obj.find('bndbox')
                xmin = int(xmlbox.find('xmin').text)
                ymin = int(xmlbox.find('ymin').text)
                xmax = int(xmlbox.find('xmax').text)
                ymax = int(xmlbox.find('ymax').text)
                w = xmax - xmin
                h = ymax - ymin

                # img = cv2.rectangle(img, (xmin, ymin), (xmax, ymax), (0, 255, 0), 2)
                w_change = (w / img_w) * input_size
                h_change = (h / img_h) * input_size
                s = w_change * h_change  # 得到了GT框面积
                width.append(sqrt(s))
                height.append(w_change / h_change)
            # print(img_path)
            # cv2.imshow('result', img)
            # cv2.waitKey()

    plt.plot(width, height, 'ro')
    plt.show()
https://blog.csdn.net/weixin_39781783/article/details/110575057
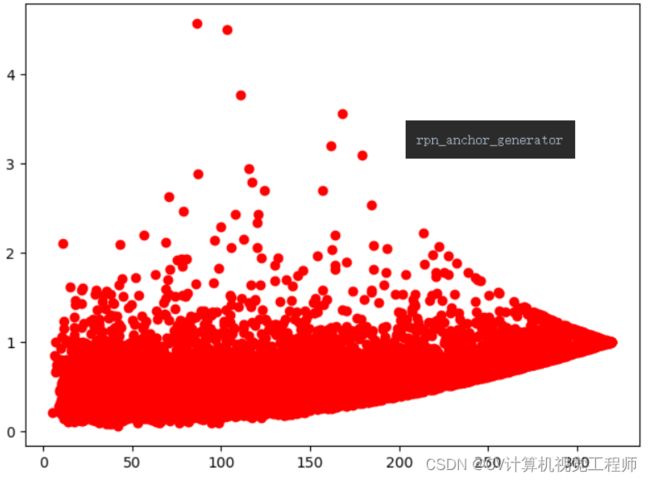
X轴代表GT框resize为网络输入分辨率时的面积的开根号,表示了尺度变化范围。Y轴代表w/h的比例,由于人一般修长一些,因此w/h比例往往是小于1的:
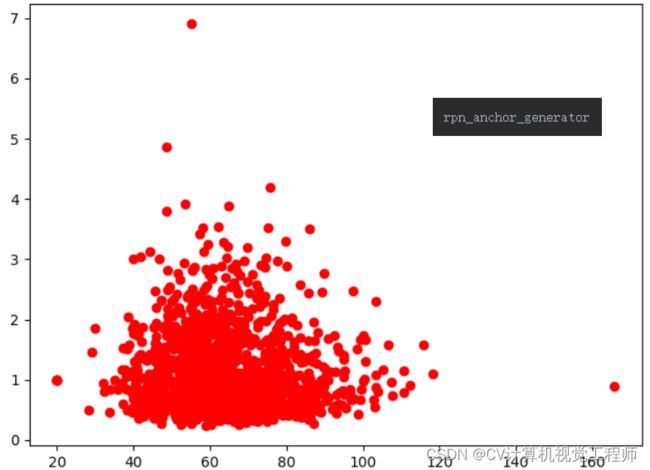
2、结核杆菌数据集分析
from PIL import Image
import xml.etree.ElementTree as ET
import pickle
import os
from os import listdir, getcwd
from os.path import join
import cv2
import matplotlib.pyplot as plt
from math import sqrt as sqrt
import pandas as pd
# 需要检查的数据
# 输入分辨率
input_size_w = 1632
input_size_h = 1224
import cv2
if __name__ == '__main__':
    DATA_PATH = 'G:/bili\compete\data——all\input/'
    # GT框宽高统计
    width = []
    height = []
    csv_path = os.path.join(DATA_PATH, 'TBDetection', 'train.csv')
    df = pd.read_csv(csv_path)
    img_file_list = list(df['image_path'].values)
    xml_file_list = list(df['xml_path'].values)
    for index, img_path in enumerate(img_file_list):
        # 这张图片的XML标注路径
        img_path = DATA_PATH + "TBDetection/" + img_path
        # print(img_path)
        # 统计宽高
        # img = Image.open(img_path)
        # imgSize = img.size  # 大小/尺寸
        # w = img.width  # 图片的宽
        # h = img.height  # 图片的高
        # if w != 1632 or h != 1224:
        #
        #     print(w, h)
        label_file = DATA_PATH + "TBDetection/" + xml_file_list[index]
        # print(label_file)
        tree = ET.parse(label_file)
        root = tree.getroot()
        img_w = 1632#int(size.find('width').text)  # 原始图片的width
        img_h = 1224#int(size.find('height').text)  # 原始图片的height
        img = cv2.imread(img_path)
        for obj in root.iter('object'):
            xmlbox = obj.find('bndbox')
            xmin = int(xmlbox.find('xmin').text)
            ymin = int(xmlbox.find('ymin').text)
            xmax = int(xmlbox.find('xmax').text)
            ymax = int(xmlbox.find('ymax').text)
            w = xmax - xmin
            h = ymax - ymin
            # print(w,h)

            # img = cv2.rectangle(img, (xmin, ymin), (xmax, ymax), (0, 255, 0), 2)
            w_change = (w / img_w) * input_size_w
            h_change = (h / img_h) * input_size_h
            s = w_change * h_change  # 得到了GT框面积
            width.append(sqrt(s))
            height.append(w_change / h_change)
        # print(img_path)
        # cv2.imshow('result', img)
        # cv2.waitKey()

    plt.plot(width, height, 'ro')
    plt.show()
3、结核杆菌数据集聚类

