R绘图 | 包含/比例关系环图
circle_inner
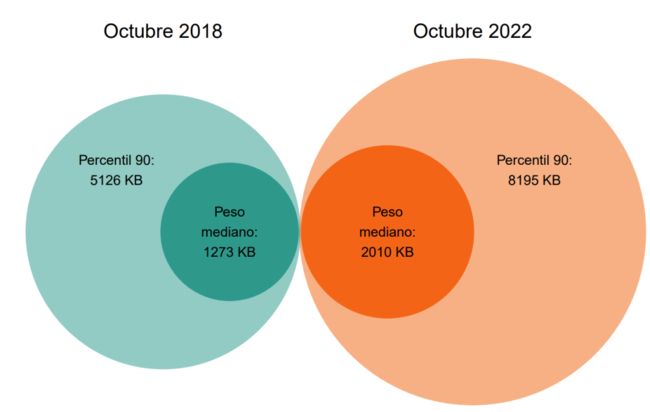 image-20221202003722770

 result
 木舟笔记矩阵
整个新系列。目前的几个系列, 「#R实战」 以「生信分析」为主, 「#跟着CNS学作图」 以「复现顶刊」Figure为主,而本系列 「#R绘图」 则是学习不在文章中但同样很好看的图,致力于给同学们在数据可视化中提供新的思路和方法。
本系列往期文章
R绘图 | 气泡散点图+拟合曲线
R绘图 | 对比条形图+连线
R绘图 | 一幅小提琴图的美化之旅
R绘图 | 山峦图(ggridges)
R绘图 | 哑铃图+区域放大
R绘图 | 描述性统计常用图(散点图+柱状图+饼图)
R绘图 | 圆角堆叠柱状图(ggchicklet )
R绘图 | 时间线热图
R绘图 | 堆叠柱状图
R绘图 | 云雨图+双向条形图
本期图片
 image-20221202003722770
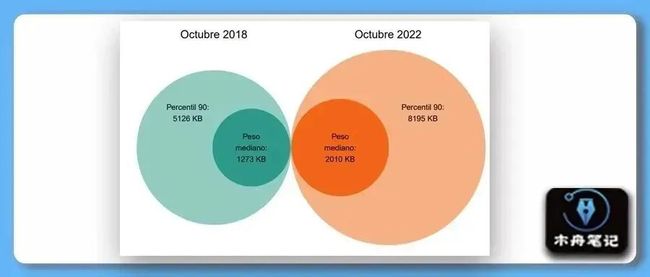
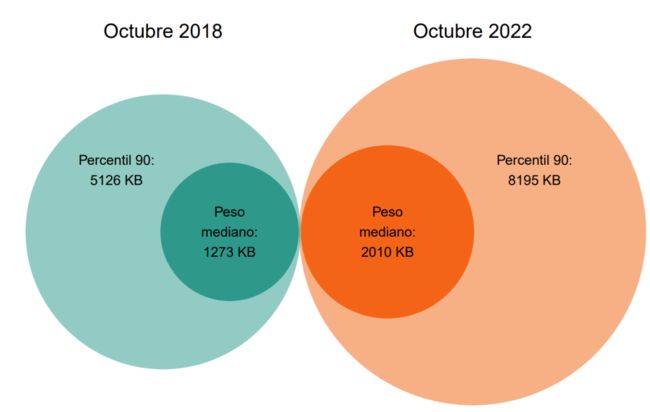
❝这图怎么说呢,看着很简单,确实也很简单。不考虑比例关系在
❞PPT里就可以做。本文主要提供了在R中绘制的思路,也让圆圈的比例更加精确,当然出现更多数据时,画的也更方便。
示例数据和代码领取
点赞、在看 本文,分享至朋友圈集赞20个并保留30分钟,截图发至微信mzbj0002领取。
「木舟笔记2022年度VIP可免费领取」。
木舟笔记2022年度VIP企划
「权益:」
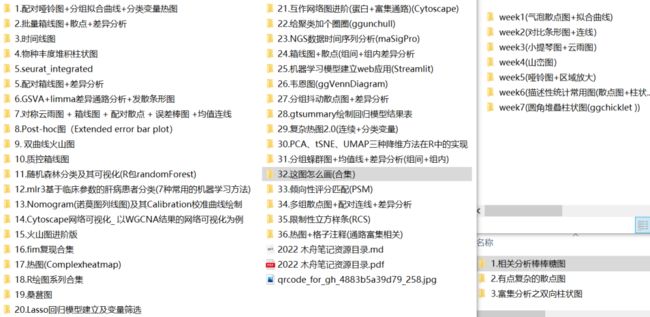
「2022」年度木舟笔记所有推文示例数据及代码(「在VIP群里实时更新」)。
 data+code
 木舟笔记「科研交流群」。
「半价」购买
跟着Cell学作图系列合集(免费教程+代码领取)|跟着Cell学作图系列合集。
「收费:」
「99¥/人」。可添加微信:mzbj0002 转账,或直接在文末打赏。

绘制
library(tidyverse)

mobile_bytes <- read.csv('mobile_bytes.csv')
head(mobile_bytes)
看一下数据结构就知道了,本质还是散点图。将数据自己的即可。
> head(mobile_bytes)
     measure       date percentile   value year     name     x
1 bytesTotal 2022_10_01        p50 2010.05 2022 p50_2022  0.45
2 bytesTotal 2022_10_01        p90 8195.38 2022 p90_2022  1.00
3 bytesTotal 2018_10_01        p50 1273.32 2018 p50_2018 -0.57
4 bytesTotal 2018_10_01        p90 5126.38 2018 p90_2018 -1.00
                    label x_label
1 Peso\nmediano:\n2010 KB    0.45
2  Percentil 90:\n8195 KB    1.40
3 Peso\nmediano:\n1273 KB   -0.57
4  Percentil 90:\n5126 KB   -1.30
mobile_bytes$year <- as.factor(mobile_bytes$year)
str(mobile_bytes)
ggplot() +
geom_point(aes(x = x, size = value, color = year), y = 0, alpha = 0.5,
data = filter(mobile_bytes, percentile == "p90")) +
geom_point(aes(x = x, size = value, color = year), y = 0,
data = filter(mobile_bytes, percentile == "p50")) +
geom_text(aes(x = x_label, label = label), y = 0.4, size = 2.5,
data = filter(mobile_bytes, percentile == "p90")) +
geom_text(aes(x = x_label, label = label), y = 0, size = 2.5,
data = filter(mobile_bytes, percentile == "p50")) +
annotate("text", x = -1, y = 1.3, label = "Octubre 2018", size = 3.5) +
annotate("text", x = 1, y = 1.3, label = "Octubre 2022", size = 3.5) +
labs(
x = NULL,
y = NULL
) +
scale_color_manual(
values = c("#1b998b", "#fb6107")
) +
scale_x_continuous(limits = c(-2, 2)) +
scale_y_continuous(limits = c(-1.0, 1.4)) +
scale_size_area(max_size = 82) +
coord_equal() +
theme(
panel.background = element_blank(),
panel.grid = element_blank(),
axis.ticks = element_blank(),
axis.text = element_blank(),
legend.position = "none"
)
# Export plot
ggsave("plot_circle.pdf",
width =1500,
height = 1200,
units = "px") result
参考
https://github.com/camartinezbu/tidytuesday/
 木舟笔记矩阵
